|
Download Data (XLS File) |
|
||||||||
|
||||||||
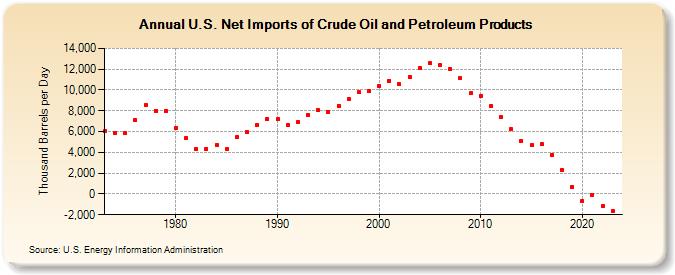
| U.S. Net Imports of Crude Oil and Petroleum Products (Thousand Barrels per Day) | ||||||||
| Decade | Year-0 | Year-1 | Year-2 | Year-3 | Year-4 | Year-5 | Year-6 | Year-7 | Year-8 | Year-9 |
|---|---|---|---|---|---|---|---|---|---|---|
| 1970's | 6,025 | 5,892 | 5,846 | 7,090 | 8,565 | 8,002 | 7,985 | |||
| 1980's | 6,365 | 5,401 | 4,298 | 4,312 | 4,715 | 4,286 | 5,439 | 5,914 | 6,587 | 7,202 |
| 1990's | 7,161 | 6,626 | 6,938 | 7,618 | 8,054 | 7,886 | 8,498 | 9,158 | 9,764 | 9,912 |
| 2000's | 10,419 | 10,900 | 10,546 | 11,238 | 12,097 | 12,549 | 12,390 | 12,036 | 11,114 | 9,667 |
| 2010's | 9,441 | 8,450 | 7,393 | 6,237 | 5,065 | 4,711 | 4,795 | 3,768 | 2,341 | 670 |
| 2020's | -635 | -62 | -1,191 | -1,709 | -2,337 |
| - = No Data Reported; -- = Not Applicable; NA = Not Available; W = Withheld to avoid disclosure of individual company data. |
| Release Date: 6/30/2025 |
| Next Release Date: 8/29/2025 |