|
Download Data (XLS File) |
|
||||||||
|
||||||||
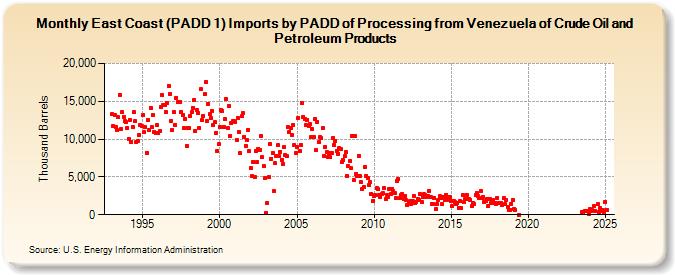
| East Coast (PADD 1) Imports by PADD of Processing from Venezuela of Crude Oil and Petroleum Products (Thousand Barrels) | ||||||||
| Year | Jan | Feb | Mar | Apr | May | Jun | Jul | Aug | Sep | Oct | Nov | Dec |
|---|---|---|---|---|---|---|---|---|---|---|---|---|
| 1993 | 13,262 | 11,755 | 13,144 | 11,579 | 11,153 | 12,887 | 15,886 | 11,391 | 13,570 | 12,953 | 12,396 | 12,247 |
| 1994 | 11,473 | 10,061 | 12,588 | 9,680 | 11,635 | 13,519 | 12,356 | 9,572 | 9,710 | 10,597 | 11,896 | 11,759 |
| 1995 | 13,135 | 10,948 | 11,592 | 8,221 | 12,531 | 11,238 | 14,155 | 11,548 | 13,199 | 10,897 | 10,775 | 11,813 |
| 1996 | 10,823 | 11,039 | 14,185 | 15,836 | 14,532 | 14,506 | 13,528 | 14,773 | 17,066 | 15,983 | 12,425 | 11,165 |
| 1997 | 13,631 | 11,898 | 15,484 | 14,900 | 14,943 | 14,924 | 13,590 | 13,125 | 11,451 | 12,705 | 9,090 | 11,504 |
| 1998 | 11,448 | 13,088 | 13,533 | 14,153 | 15,203 | 11,075 | 13,874 | 13,492 | 11,447 | 16,596 | 12,487 | 13,111 |
| 1999 | 15,957 | 17,594 | 12,394 | 14,676 | 13,275 | 12,789 | 13,729 | 11,827 | 12,205 | 10,866 | 8,376 | 9,294 |
| 2000 | 11,621 | 13,849 | 13,729 | 11,571 | 12,610 | 15,274 | 11,495 | 14,376 | 10,473 | 12,096 | 12,343 | 12,394 |
| 2001 | 12,311 | 9,866 | 12,778 | 10,954 | 8,143 | 13,046 | 13,387 | 10,261 | 9,146 | 9,828 | 11,249 | 8,374 |
| 2002 | 6,145 | 5,073 | 7,022 | 4,946 | 8,393 | 6,995 | 8,747 | 8,518 | 10,472 | 7,570 | 6,465 | 4,839 |
| 2003 | 271 | 1,566 | 5,009 | 9,383 | 7,426 | 8,166 | 3,088 | 6,782 | 7,773 | 9,162 | 7,787 | 8,300 |
| 2004 | 7,276 | 6,708 | 8,929 | 7,855 | 7,720 | 11,566 | 10,982 | 11,518 | 10,554 | 11,876 | 9,193 | 8,127 |
| 2005 | 8,912 | 12,794 | 8,439 | 9,262 | 14,793 | 12,942 | 12,623 | 11,830 | 12,513 | 11,774 | 11,960 | 10,269 |
| 2006 | 11,323 | 10,215 | 12,710 | 8,519 | 12,300 | 9,613 | 10,222 | 10,082 | 11,415 | 7,778 | 8,977 | 8,240 |
| 2007 | 7,682 | 8,122 | 7,569 | 8,196 | 10,159 | 9,259 | 9,761 | 8,452 | 8,089 | 8,835 | 8,697 | 6,948 |
| 2008 | 7,264 | 7,726 | 8,313 | 5,121 | 6,387 | 7,076 | 6,144 | 10,413 | 4,529 | 10,452 | 5,411 | 5,107 |
| 2009 | 7,813 | 5,102 | 4,292 | 3,462 | 3,712 | 6,342 | 5,148 | 4,839 | 3,982 | 4,280 | 2,747 | 1,842 |
| 2010 | 2,478 | 2,609 | 3,519 | 3,348 | 2,615 | 2,364 | 2,692 | 2,807 | 3,470 | 2,015 | 2,629 | 2,381 |
| 2011 | 3,388 | 2,699 | 3,402 | 3,088 | 2,884 | 2,184 | 4,498 | 4,737 | 2,206 | 2,588 | 2,781 | 2,109 |
| 2012 | 2,424 | 1,883 | 1,239 | 1,734 | 1,752 | 1,473 | 1,825 | 2,480 | 1,594 | 1,747 | 2,106 | 2,010 |
| 2013 | 2,699 | 1,634 | 2,321 | 2,681 | 2,577 | 2,394 | 2,501 | 3,179 | 2,281 | 1,458 | 1,434 | 2,260 |
| 2014 | 783 | 1,398 | 1,987 | 2,422 | 2,199 | 1,382 | 2,282 | 1,899 | 2,665 | 2,306 | 2,012 | 2,377 |
| 2015 | 1,796 | 1,093 | 1,842 | 1,659 | 1,406 | 1,486 | 938 | 1,826 | 888 | 2,544 | 1,656 | 2,069 |
| 2016 | 2,659 | 2,125 | 2,108 | 1,999 | 1,137 | 1,590 | 1,353 | 2,608 | 2,842 | 2,515 | 2,238 | 3,125 |
| 2017 | 2,190 | 2,402 | 1,744 | 1,843 | 2,076 | 1,210 | 2,024 | 1,585 | 1,585 | 1,924 | 1,588 | 1,373 |
| 2018 | 2,268 | 1,567 | 1,611 | 1,555 | 1,347 | 2,146 | 1,408 | 1,930 | 1,065 | 594 | 657 | 1,472 |
| 2019 | 1,952 | 803 | 689 | 7 | ||||||||
| 2023 | 312 | 344 | 498 | 497 | 84 | |||||||
| 2024 | 708 | 498 | 579 | 1,108 | ||||||||
| - = No Data Reported; -- = Not Applicable; NA = Not Available; W = Withheld to avoid disclosure of individual company data. |
| Release Date: 6/28/2024 |
| Next Release Date: 7/31/2024 |