|
Download Data (XLS File) |
|
||||||||
|
||||||||
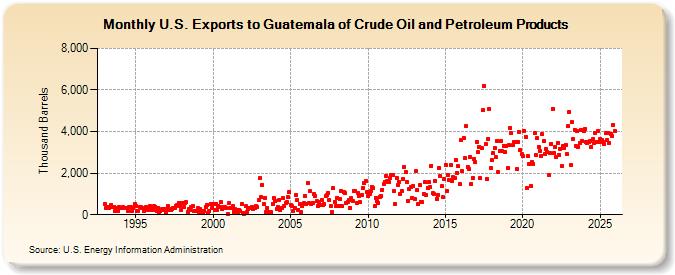
| U.S. Exports to Guatemala of Crude Oil and Petroleum Products (Thousand Barrels) | ||||||||
| Year | Jan | Feb | Mar | Apr | May | Jun | Jul | Aug | Sep | Oct | Nov | Dec |
|---|---|---|---|---|---|---|---|---|---|---|---|---|
| 1993 | 515 | 309 | 359 | 346 | 375 | 469 | 352 | 385 | 194 | 336 | 169 | 354 |
| 1994 | 333 | 325 | 363 | 302 | 335 | 344 | 183 | 350 | 353 | 186 | 339 | 519 |
| 1995 | 421 | 181 | 175 | 381 | 351 | 341 | 169 | 211 | 365 | 344 | 208 | 426 |
| 1996 | 394 | 235 | 417 | 385 | 171 | 345 | 150 | 178 | 260 | 239 | 296 | 77 |
| 1997 | 265 | 414 | 237 | 247 | 263 | 336 | 334 | 436 | 444 | 565 | 443 | 223 |
| 1998 | 579 | 363 | 584 | 607 | 137 | 271 | 208 | 379 | 404 | 173 | 182 | 166 |
| 1999 | 308 | 143 | 254 | 186 | 93 | 191 | 392 | 491 | 100 | 157 | 496 | 319 |
| 2000 | 511 | 224 | 516 | 212 | 432 | 392 | 599 | 251 | 376 | 357 | 331 | 51 |
| 2001 | 550 | 324 | 314 | 405 | 145 | 255 | 206 | 112 | 240 | 162 | 533 | 72 |
| 2002 | 49 | 400 | 124 | 294 | 344 | 304 | 393 | 285 | 318 | 417 | 376 | 686 |
| 2003 | 1,742 | 829 | 1,449 | 527 | 818 | 153 | 325 | 116 | 135 | 118 | 527 | 812 |
| 2004 | 669 | 267 | 369 | 718 | 217 | 331 | 794 | 419 | 567 | 611 | 846 | 1,102 |
| 2005 | 457 | 397 | 194 | 316 | 944 | 717 | 243 | 516 | 107 | 396 | 545 | 923 |
| 2006 | 509 | 1,514 | 547 | 1,126 | 506 | 575 | 995 | 903 | 640 | 433 | 603 | 481 |
| 2007 | 704 | 476 | 495 | 883 | 955 | 1,068 | 700 | 432 | 140 | 1,276 | 630 | 427 |
| 2008 | 817 | 427 | 737 | 1,144 | 419 | 1,071 | 1,025 | 557 | 618 | 716 | 325 | 804 |
| 2009 | 655 | 1,151 | 1,144 | 545 | 1,062 | 888 | 611 | 929 | 1,285 | 1,507 | 1,612 | 1,113 |
| 2010 | 920 | 977 | 1,140 | 1,348 | 1,262 | 399 | 824 | 650 | 567 | 866 | 923 | 1,209 |
| 2011 | 1,458 | 1,586 | 1,879 | 1,620 | 1,581 | 1,770 | 1,910 | 1,900 | 1,126 | 515 | 1,785 | 1,416 |
| 2012 | 1,580 | 1,010 | 1,148 | 1,729 | 2,301 | 2,054 | 1,581 | 677 | 1,215 | 1,314 | 822 | 1,371 |
| 2013 | 777 | 2,087 | 1,209 | 499 | 1,421 | 626 | 600 | 998 | 1,567 | 928 | 1,287 | 1,558 |
| 2014 | 1,333 | 2,364 | 1,031 | 992 | 1,645 | 777 | 951 | 2,243 | 1,850 | 1,369 | 833 | 1,740 |
| 2015 | 2,412 | 1,150 | 1,922 | 1,688 | 2,382 | 1,639 | 1,798 | 1,768 | 2,652 | 2,022 | 2,320 | 1,473 |
| 2016 | 3,598 | 2,096 | 3,709 | 2,706 | 4,254 | 2,298 | 2,220 | 2,770 | 1,478 | 1,776 | 2,684 | 2,516 |
| 2017 | 3,515 | 3,010 | 3,281 | 1,762 | 3,197 | 5,013 | 6,201 | 3,395 | 1,717 | 3,642 | 5,084 | 2,262 |
| 2018 | 2,611 | 2,954 | 3,217 | 2,763 | 3,559 | 2,039 | 3,070 | 3,542 | 3,044 | 3,325 | 3,023 | 3,297 |
| 2019 | 2,246 | 3,334 | 4,185 | 3,923 | 3,332 | 3,495 | 3,507 | 2,181 | 3,520 | 3,992 | 3,134 | 2,906 |
| 2020 | 2,801 | 4,029 | 3,757 | 1,293 | 2,818 | 2,417 | 1,378 | 2,534 | 2,446 | 3,912 | 2,861 | 3,674 |
| 2021 | 3,276 | 3,053 | 2,843 | 3,868 | 3,539 | 2,939 | 3,153 | 3,016 | 1,911 | 2,960 | 3,418 | 5,106 |
| 2022 | 2,980 | 3,264 | 2,775 | 3,468 | 2,878 | 3,173 | 2,350 | 3,310 | 3,232 | 3,372 | 2,902 | 4,266 |
| 2023 | 5,129 | 2,259 | 4,905 | 3,308 | 4,096 | 3,487 | 3,825 | 3,286 | 3,252 | 4,293 | 3,557 | 4,016 |
| 2024 | 3,836 | |||||||||||
| - = No Data Reported; -- = Not Applicable; NA = Not Available; W = Withheld to avoid disclosure of individual company data. |
| Release Date: 3/29/2024 |
| Next Release Date: 4/30/2024 |