|
Download Data (XLS File) |
|
||||||||
|
||||||||
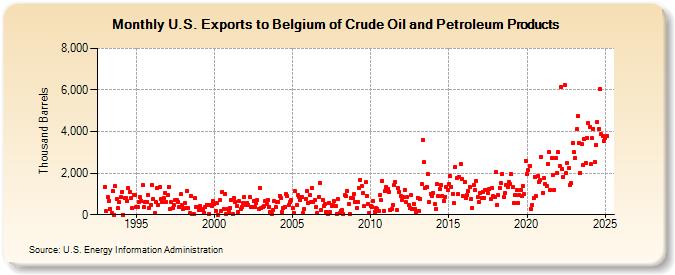
| U.S. Exports to Belgium of Crude Oil and Petroleum Products (Thousand Barrels) | ||||||||
| Year | Jan | Feb | Mar | Apr | May | Jun | Jul | Aug | Sep | Oct | Nov | Dec |
|---|---|---|---|---|---|---|---|---|---|---|---|---|
| 1993 | 1,335 | 175 | 833 | 675 | 292 | 80 | 1,124 | 9 | 1,373 | 761 | 300 | 608 |
| 1994 | 832 | 1,096 | 4 | 793 | 813 | 641 | 1,292 | 1,096 | 810 | 308 | 951 | 968 |
| 1995 | 390 | 391 | 598 | 851 | 674 | 1,415 | 358 | 629 | 634 | 952 | 335 | 487 |
| 1996 | 1,443 | 750 | 95 | 590 | 1,273 | 482 | 1,311 | 738 | 609 | 792 | 1,067 | 614 |
| 1997 | 931 | 1,347 | 297 | 598 | 324 | 485 | 715 | 715 | 630 | 365 | 978 | 459 |
| 1998 | 298 | 551 | 328 | 1,146 | 300 | 73 | 898 | 37 | 56 | 781 | 385 | 392 |
| 1999 | 220 | 406 | 294 | 242 | 103 | 381 | 480 | 468 | 35 | 486 | 438 | 638 |
| 2000 | 513 | 199 | 561 | 9 | 684 | 187 | 1,110 | 278 | 1,020 | 28 | 281 | 149 |
| 2001 | 346 | 721 | 26 | 820 | 621 | 441 | 145 | 641 | 262 | 378 | 566 | 833 |
| 2002 | 452 | 580 | 486 | 832 | 362 | 372 | 659 | 393 | 570 | 698 | 278 | 1,299 |
| 2003 | 311 | 356 | 403 | 656 | 526 | 729 | 366 | 145 | 15 | 214 | 653 | 391 |
| 2004 | 601 | 620 | 902 | 794 | 132 | 312 | 391 | 985 | 882 | 477 | 608 | 692 |
| 2005 | 318 | 101 | 1,120 | 458 | 948 | 852 | 701 | 853 | 62 | 278 | 756 | 1,148 |
| 2006 | 580 | 934 | 604 | 1,297 | 613 | 701 | 377 | 84 | 845 | 1,548 | 236 | 690 |
| 2007 | 439 | 517 | 136 | 55 | 577 | 122 | 430 | 478 | 667 | 396 | 44 | 748 |
| 2008 | 70 | 178 | 220 | 45 | 935 | 881 | 1,129 | 519 | 58 | 785 | 822 | 981 |
| 2009 | 624 | 332 | 603 | 1,298 | 1,690 | 1,360 | 1,037 | 407 | 1,556 | 922 | 499 | 86 |
| 2010 | 397 | 392 | 649 | 132 | 326 | 292 | 187 | 959 | 691 | 1,613 | 188 | 1,136 |
| 2011 | 1,309 | 1,253 | 1,111 | 209 | 276 | 482 | 1,406 | 1,583 | 230 | 1,271 | 1,110 | 877 |
| 2012 | 722 | 830 | 1,202 | 596 | 837 | 455 | 314 | 936 | 296 | 537 | 278 | 138 |
| 2013 | 819 | 196 | 776 | 1,457 | 3,595 | 2,524 | 1,307 | 1,343 | 1,967 | 633 | 1,008 | 887 |
| 2014 | 1,057 | 517 | 275 | 1,463 | 908 | 1,232 | 1,441 | 918 | 668 | 876 | 1,354 | 1,208 |
| 2015 | 1,461 | 1,846 | 1,349 | 1,019 | 550 | 2,304 | 1,762 | 993 | 1,837 | 2,434 | 1,711 | 883 |
| 2016 | 1,565 | 807 | 936 | 1,151 | 1,350 | 770 | 342 | 1,440 | 1,195 | 1,641 | 859 | 622 |
| 2017 | 1,066 | 814 | 1,074 | 816 | 1,171 | 1,177 | 1,026 | 1,246 | 747 | 1,288 | 885 | 844 |
| 2018 | 2,036 | 482 | 925 | 1,298 | 1,507 | 1,961 | 835 | 1,024 | 1,451 | 1,317 | 1,586 | 1,486 |
| 2019 | 1,939 | 1,318 | 566 | 961 | 1,180 | 573 | 944 | 1,212 | 878 | 1,381 | 981 | 2,607 |
| 2020 | 1,968 | 2,135 | 2,360 | 256 | 452 | 783 | 1,834 | 888 | 1,852 | 1,597 | 1,646 | 2,798 |
| 2021 | 1,057 | 1,743 | 1,463 | 1,373 | 2,435 | 2,999 | 1,193 | 2,743 | 1,924 | 1,192 | 2,725 | 2,029 |
| 2022 | 3,004 | 2,352 | 6,144 | 2,178 | 1,838 | 6,236 | 1,989 | 2,466 | 2,228 | 1,431 | 1,512 | 3,448 |
| 2023 | 3,530 | 2,295 | 3,424 | 4,552 | 3,270 | 2,224 | 3,714 | 1,969 | 3,182 | 2,500 | 3,740 | 4,511 |
| 2024 | 4,234 | 2,427 | 3,687 | 4,142 | ||||||||
| - = No Data Reported; -- = Not Applicable; NA = Not Available; W = Withheld to avoid disclosure of individual company data. |
| Release Date: 6/28/2024 |
| Next Release Date: 7/31/2024 |