|
Download Data (XLS File) |
|
||||||||
|
||||||||
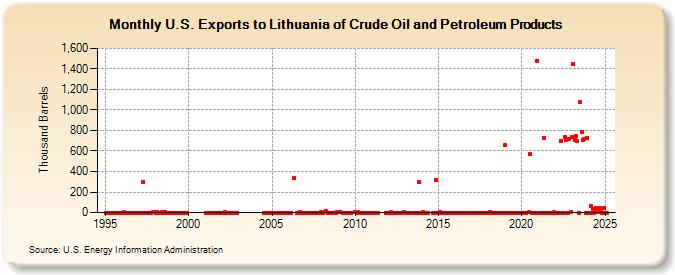
| U.S. Exports to Lithuania of Crude Oil and Petroleum Products (Thousand Barrels) | ||||||||
| Year | Jan | Feb | Mar | Apr | May | Jun | Jul | Aug | Sep | Oct | Nov | Dec |
|---|---|---|---|---|---|---|---|---|---|---|---|---|
| 1995 | 0 | 0 | 0 | 0 | 0 | 0 | 0 | 0 | 0 | 0 | 0 | 0 |
| 1996 | 0 | 1 | 0 | 0 | 0 | 0 | 0 | 0 | 0 | 0 | 0 | 0 |
| 1997 | 0 | 0 | 0 | 300 | 0 | 0 | 0 | 0 | 0 | 0 | 1 | 1 |
| 1998 | 0 | 1 | 0 | 0 | 0 | 1 | 0 | 1 | 0 | 0 | 0 | 0 |
| 1999 | 0 | 0 | 0 | 0 | 0 | 0 | 0 | 0 | 0 | 0 | 0 | 0 |
| 2001 | 0 | 0 | 0 | 0 | 0 | 0 | 0 | 0 | 0 | 0 | 0 | 0 |
| 2002 | 0 | 0 | 1 | 0 | 0 | 0 | 0 | 0 | 0 | 0 | 0 | 0 |
| 2004 | 0 | 0 | 0 | 0 | 0 | |||||||
| 2005 | 0 | 0 | 0 | 0 | 0 | 0 | 0 | 0 | ||||
| 2006 | 0 | 339 | 0 | 0 | 1 | 0 | 0 | 0 | ||||
| 2007 | 0 | 0 | 0 | 0 | 0 | 0 | 0 | 0 | 0 | 1 | ||
| 2008 | 0 | 0 | 1 | 14 | 0 | 0 | 0 | 0 | 0 | 0 | 1 | |
| 2009 | 1 | 0 | 0 | 0 | 0 | 0 | 0 | 0 | ||||
| 2010 | 1 | 0 | 1 | 0 | 0 | 0 | 0 | 0 | 0 | 0 | ||
| 2011 | 0 | 0 | 0 | 0 | 0 | 0 | ||||||
| 2012 | 0 | 1 | 0 | 0 | 0 | 0 | 0 | 2 | ||||
| 2013 | 0 | 0 | 0 | 0 | 0 | 0 | 0 | 0 | 300 | |||
| 2014 | 0 | 1 | 0 | 0 | 0 | 0 | 322 | 0 | ||||
| 2015 | 0 | 1 | 0 | 0 | 0 | 0 | 0 | 0 | 0 | 0 | 0 | |
| 2016 | 0 | 0 | 0 | 0 | 0 | 0 | 0 | 0 | ||||
| 2017 | 0 | 0 | 0 | 0 | 0 | 0 | 0 | 0 | ||||
| 2018 | 2 | 0 | 0 | 0 | 0 | 0 | 0 | 0 | ||||
| 2019 | 658 | 0 | 0 | 0 | 0 | 0 | 0 | 0 | 0 | 0 | ||
| 2020 | 0 | 0 | 0 | 0 | 1 | 571 | 0 | 0 | 0 | 0 | 1,481 | |
| 2021 | 0 | 0 | 0 | 730 | 0 | 0 | 0 | 0 | 0 | 0 | 1 | |
| 2022 | 0 | 0 | 0 | 699 | 0 | 0 | 735 | 710 | 0 | 720 | 1 | |
| 2023 | 736 | 725 | 1,503 | 750 | 694 | 0 | 1,073 | 788 | 2 | 721 | 0 | 731 |
| 2024 | 0 | |||||||||||
| - = No Data Reported; -- = Not Applicable; NA = Not Available; W = Withheld to avoid disclosure of individual company data. |
| Release Date: 3/29/2024 |
| Next Release Date: 4/30/2024 |