|
Download Data (XLS File) |
|
||||||||
|
||||||||
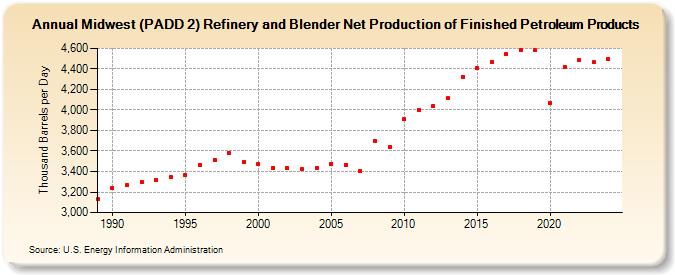
| Midwest (PADD 2) Refinery and Blender Net Production of Finished Petroleum Products (Thousand Barrels per Day) | ||||||||
| Decade | Year-0 | Year-1 | Year-2 | Year-3 | Year-4 | Year-5 | Year-6 | Year-7 | Year-8 | Year-9 |
|---|---|---|---|---|---|---|---|---|---|---|
| 1980's | 3,132 | |||||||||
| 1990's | 3,243 | 3,267 | 3,300 | 3,322 | 3,344 | 3,363 | 3,465 | 3,517 | 3,582 | 3,495 |
| 2000's | 3,478 | 3,439 | 3,430 | 3,421 | 3,437 | 3,478 | 3,468 | 3,405 | 3,698 | 3,642 |
| 2010's | 3,909 | 4,001 | 4,042 | 4,113 | 4,326 | 4,407 | 4,470 | 4,541 | 4,586 | 4,580 |
| 2020's | 4,070 | 4,420 | 4,483 | 4,463 |
| - = No Data Reported; -- = Not Applicable; NA = Not Available; W = Withheld to avoid disclosure of individual company data. |
| Release Date: 3/29/2024 |
| Next Release Date: 8/30/2024 |