|
Download Data (XLS File) |
|
||||||||
|
||||||||
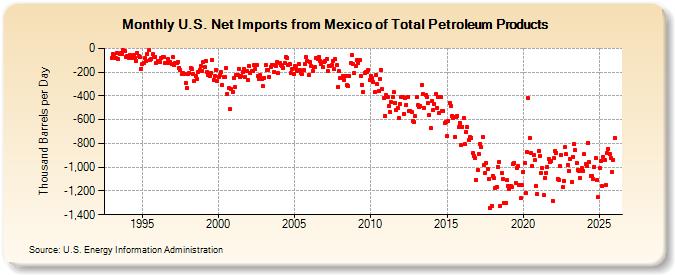
| U.S. Net Imports from Mexico of Total Petroleum Products (Thousand Barrels per Day) | ||||||||
| Year | Jan | Feb | Mar | Apr | May | Jun | Jul | Aug | Sep | Oct | Nov | Dec |
|---|---|---|---|---|---|---|---|---|---|---|---|---|
| 1993 | -78 | -48 | -72 | -81 | -40 | -91 | -44 | -39 | -45 | -16 | -24 | -71 |
| 1994 | -63 | -78 | -59 | -76 | -82 | -57 | -80 | -104 | -38 | -61 | -75 | -171 |
| 1995 | -131 | -119 | -85 | -106 | -46 | -16 | -96 | -91 | -49 | -74 | -72 | -121 |
| 1996 | -102 | -103 | -117 | -85 | -71 | -75 | -126 | -119 | -92 | -127 | -112 | -131 |
| 1997 | -76 | -144 | -120 | -124 | -112 | -161 | -185 | -213 | -206 | -214 | -291 | -331 |
| 1998 | -219 | -211 | -165 | -177 | -212 | -271 | -233 | -260 | -200 | -179 | -148 | -187 |
| 1999 | -116 | -160 | -104 | -196 | -226 | -231 | -204 | -98 | -263 | -236 | -179 | -276 |
| 2000 | -240 | -228 | -198 | -310 | -241 | -240 | -163 | -385 | -334 | -514 | -345 | -367 |
| 2001 | -250 | -328 | -225 | -226 | -170 | -241 | -234 | -198 | -176 | -239 | -189 | -264 |
| 2002 | -149 | -210 | -192 | -188 | -144 | -173 | -138 | -233 | -261 | -224 | -260 | -320 |
| 2003 | -247 | -140 | -182 | -178 | -238 | -155 | -137 | -137 | -196 | -146 | -116 | -211 |
| 2004 | -125 | -140 | -151 | -166 | -119 | -69 | -78 | -136 | -130 | -208 | -174 | -214 |
| 2005 | -146 | -164 | -187 | -133 | -180 | -204 | -217 | -186 | -128 | -69 | -104 | -220 |
| 2006 | -118 | -149 | -190 | -158 | -158 | -78 | -86 | -72 | -102 | -134 | -156 | -117 |
| 2007 | -102 | -91 | -192 | -148 | -147 | -143 | -105 | -177 | -93 | -141 | -324 | -192 |
| 2008 | -247 | -253 | -230 | -268 | -234 | -311 | -317 | -234 | -127 | -56 | -133 | -207 |
| 2009 | -151 | -101 | -126 | -101 | -232 | -306 | -364 | -206 | -198 | -200 | -183 | -265 |
| 2010 | -230 | -252 | -281 | -368 | -222 | -299 | -360 | -259 | -182 | -346 | -417 | -566 |
| 2011 | -394 | -407 | -488 | -534 | -451 | -408 | -370 | -457 | -518 | -500 | -587 | -466 |
| 2012 | -411 | -408 | -550 | -415 | -474 | -406 | -527 | -525 | -534 | -607 | -619 | -573 |
| 2013 | -413 | -480 | -496 | -485 | -307 | -385 | -501 | -391 | -406 | -463 | -561 | -673 |
| 2014 | -443 | -522 | -467 | -387 | -499 | -409 | -543 | -405 | -524 | -526 | -629 | -617 |
| 2015 | -740 | -610 | -456 | -484 | -565 | -587 | -742 | -574 | -569 | -664 | -628 | -814 |
| 2016 | -658 | -584 | -808 | -704 | -663 | -770 | -748 | -752 | -881 | -908 | -919 | -1,107 |
| 2017 | -1,025 | -889 | -804 | -834 | -747 | -979 | -1,045 | -964 | -1,017 | -1,096 | -1,341 | -1,324 |
| 2018 | -1,072 | -1,095 | -1,176 | -1,165 | -996 | -955 | -1,323 | -1,047 | -1,101 | -1,299 | -1,299 | -1,112 |
| 2019 | -1,155 | -1,181 | -1,155 | -1,169 | -970 | -965 | -1,131 | -1,007 | -990 | -1,148 | -1,263 | -1,154 |
| 2020 | -1,037 | -964 | -1,220 | -874 | -421 | -754 | -882 | -990 | -896 | -943 | -1,158 | -1,227 |
| 2021 | -863 | -905 | -1,049 | -1,008 | -1,235 | -1,090 | -1,046 | -1,000 | -929 | -958 | -951 | -1,282 |
| 2022 | -926 | -862 | -878 | -1,099 | -1,104 | -994 | -899 | -1,170 | -1,118 | -833 | -893 | -983 |
| 2023 | -1,034 | -931 | -1,123 | -910 | -808 | -857 | -963 | -1,020 | -1,033 | -1,090 | -1,010 | -1,031 |
| 2024 | -891 | -946 | -970 | -793 | -965 | -1,091 | ||||||
| - = No Data Reported; -- = Not Applicable; NA = Not Available; W = Withheld to avoid disclosure of individual company data. |
| Release Date: 8/30/2024 |
| Next Release Date: 9/30/2024 |