|
Download Data (XLS File) |
|
||||||||
|
||||||||
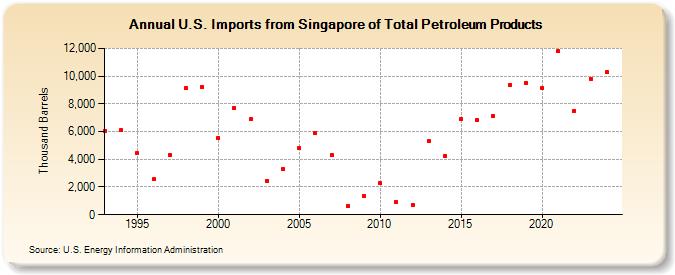
| U.S. Imports from Singapore of Total Petroleum Products (Thousand Barrels) | ||||||||
| Decade | Year-0 | Year-1 | Year-2 | Year-3 | Year-4 | Year-5 | Year-6 | Year-7 | Year-8 | Year-9 |
|---|---|---|---|---|---|---|---|---|---|---|
| 1990's | 6,045 | 6,102 | 4,432 | 2,553 | 4,317 | 9,146 | 9,219 | |||
| 2000's | 5,549 | 7,696 | 6,873 | 2,461 | 3,268 | 4,804 | 5,905 | 4,293 | 649 | 1,319 |
| 2010's | 2,268 | 919 | 709 | 5,304 | 4,252 | 6,911 | 6,810 | 7,133 | 9,367 | 9,537 |
| 2020's | 9,131 | 11,801 | 7,492 | 9,794 |
| - = No Data Reported; -- = Not Applicable; NA = Not Available; W = Withheld to avoid disclosure of individual company data. |
| Release Date: 6/28/2024 |
| Next Release Date: 8/30/2024 |