|
Download Data (XLS File) |
|
||||||||
|
||||||||
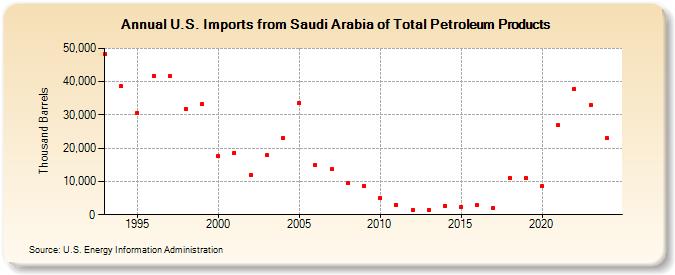
| U.S. Imports from Saudi Arabia of Total Petroleum Products (Thousand Barrels) | ||||||||
| Decade | Year-0 | Year-1 | Year-2 | Year-3 | Year-4 | Year-5 | Year-6 | Year-7 | Year-8 | Year-9 |
|---|---|---|---|---|---|---|---|---|---|---|
| 1990's | 48,256 | 38,555 | 30,661 | 41,834 | 41,600 | 31,849 | 33,290 | |||
| 2000's | 17,705 | 18,678 | 12,012 | 17,846 | 23,012 | 33,536 | 14,907 | 13,798 | 9,474 | 8,731 |
| 2010's | 5,160 | 3,048 | 1,486 | 1,367 | 2,703 | 2,434 | 2,807 | 2,054 | 11,137 | 11,113 |
| 2020's | 8,674 | 26,840 | 37,858 | 32,971 |
| - = No Data Reported; -- = Not Applicable; NA = Not Available; W = Withheld to avoid disclosure of individual company data. |
| Release Date: 8/30/2024 |
| Next Release Date: 8/29/2025 |