|
Download Data (XLS File) |
|
||||||||
|
||||||||
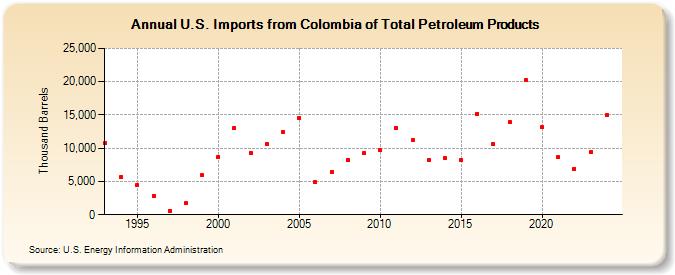
| U.S. Imports from Colombia of Total Petroleum Products (Thousand Barrels) | ||||||||
| Decade | Year-0 | Year-1 | Year-2 | Year-3 | Year-4 | Year-5 | Year-6 | Year-7 | Year-8 | Year-9 |
|---|---|---|---|---|---|---|---|---|---|---|
| 1990's | 10,757 | 5,729 | 4,393 | 2,861 | 617 | 1,716 | 5,904 | |||
| 2000's | 8,738 | 13,052 | 9,275 | 10,582 | 12,364 | 14,530 | 4,902 | 6,388 | 8,236 | 9,293 |
| 2010's | 9,677 | 13,086 | 11,158 | 8,194 | 8,457 | 8,208 | 15,210 | 10,612 | 13,879 | 20,198 |
| 2020's | 13,139 | 8,604 | 6,918 | 9,359 |
| - = No Data Reported; -- = Not Applicable; NA = Not Available; W = Withheld to avoid disclosure of individual company data. |
| Release Date: 6/28/2024 |
| Next Release Date: 8/30/2024 |