|
Download Data (XLS File) |
|
||||||||
|
||||||||
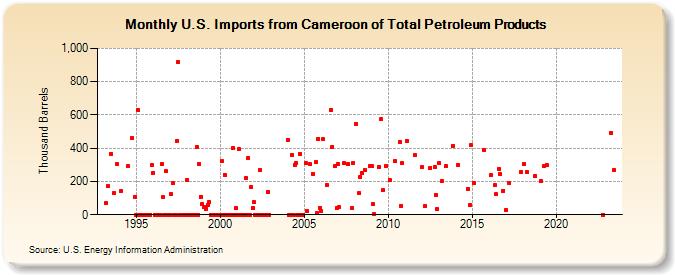
| U.S. Imports from Cameroon of Total Petroleum Products (Thousand Barrels) | ||||||||
| Year | Jan | Feb | Mar | Apr | May | Jun | Jul | Aug | Sep | Oct | Nov | Dec |
|---|---|---|---|---|---|---|---|---|---|---|---|---|
| 1993 | 69 | 170 | 367 | 132 | 303 | |||||||
| 1994 | 143 | 291 | 460 | 108 | ||||||||
| 1995 | 0 | 630 | 0 | 0 | 0 | 0 | 0 | 0 | 0 | 0 | 0 | 297 |
| 1996 | 252 | 0 | 0 | 0 | 0 | 0 | 304 | 104 | 0 | 261 | 0 | 0 |
| 1997 | 0 | 122 | 191 | 0 | 0 | 444 | 918 | 0 | 0 | 0 | 0 | 0 |
| 1998 | 209 | 0 | 0 | 0 | 0 | 0 | 0 | 409 | 0 | 304 | 108 | 65 |
| 1999 | 45 | 45 | 36 | 59 | 76 | 0 | 0 | 0 | 0 | 0 | 0 | 0 |
| 2000 | 0 | 322 | 0 | 241 | 0 | 0 | 0 | 0 | 0 | 401 | 0 | 40 |
| 2001 | 0 | 394 | 0 | 0 | 0 | 0 | 221 | 0 | 342 | 0 | 167 | 40 |
| 2002 | 74 | 0 | 0 | 0 | 270 | 0 | 0 | 0 | 0 | 0 | 139 | 0 |
| 2004 | 452 | 0 | 0 | 362 | 0 | 300 | 311 | 0 | 0 | 367 | 0 | 0 |
| 2005 | 309 | 20 | 302 | 247 | 314 | 10 | 457 | 40 | ||||
| 2006 | 25 | 453 | 180 | 631 | 408 | 290 | 40 | |||||
| 2007 | 302 | 45 | 309 | 303 | 41 | 312 | ||||||
| 2008 | 546 | 129 | 228 | 253 | 268 | 291 | ||||||
| 2009 | 293 | 62 | 4 | 287 | 573 | 147 | 290 | |||||
| 2010 | 206 | 322 | 439 | 55 | 309 | |||||||
| 2011 | 446 | 357 | ||||||||||
| 2012 | 286 | 52 | 283 | 286 | 121 | 32 | ||||||
| 2013 | 309 | 200 | 291 | 415 | ||||||||
| 2014 | 300 | 157 | 57 | 419 | ||||||||
| 2015 | 191 | 389 | ||||||||||
| 2016 | 237 | 178 | 122 | 272 | 242 | 145 | ||||||
| 2017 | 26 | 193 | 258 | |||||||||
| 2018 | 304 | 255 | 232 | |||||||||
| 2019 | 204 | 290 | 299 | |||||||||
| 2022 | 1 | |||||||||||
| 2023 | 493 | 269 | ||||||||||
| - = No Data Reported; -- = Not Applicable; NA = Not Available; W = Withheld to avoid disclosure of individual company data. |
| Release Date: 4/30/2024 |
| Next Release Date: 5/31/2024 |