|
Download Data (XLS File) |
|
||||||||
|
||||||||
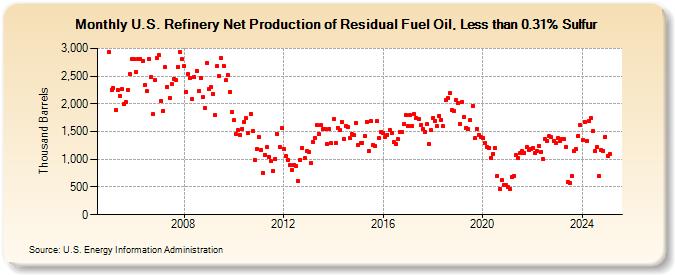
| U.S. Refinery Net Production of Residual Fuel Oil, Less than 0.31% Sulfur (Thousand Barrels) | ||||||||
| Year | Jan | Feb | Mar | Apr | May | Jun | Jul | Aug | Sep | Oct | Nov | Dec |
|---|---|---|---|---|---|---|---|---|---|---|---|---|
| 2005 | 2,938 | 2,254 | 2,289 | 1,889 | 2,256 | 2,146 | 2,262 | 1,998 | 2,027 | 2,252 | 2,531 | 2,807 |
| 2006 | 2,804 | 2,568 | 2,801 | 2,807 | 2,773 | 2,332 | 2,227 | 2,810 | 2,475 | 1,811 | 2,421 | 2,831 |
| 2007 | 2,876 | 2,055 | 1,877 | 2,656 | 2,307 | 2,109 | 2,358 | 2,454 | 2,431 | 2,671 | 2,927 | 2,805 |
| 2008 | 2,679 | 2,206 | 2,537 | 2,466 | 2,090 | 2,484 | 2,599 | 2,228 | 2,472 | 2,122 | 1,923 | 2,737 |
| 2009 | 2,263 | 2,298 | 2,185 | 1,790 | 2,674 | 2,498 | 2,824 | 2,683 | 2,422 | 2,514 | 2,222 | 1,847 |
| 2010 | 1,702 | 1,451 | 1,520 | 1,444 | 1,547 | 1,677 | 1,737 | 1,470 | 1,823 | 1,517 | 993 | 1,179 |
| 2011 | 1,404 | 1,171 | 760 | 1,084 | 1,213 | 1,046 | 961 | 795 | 1,001 | 1,454 | 1,221 | 1,563 |
| 2012 | 1,188 | 1,052 | 988 | 894 | 814 | 899 | 878 | 608 | 988 | 1,208 | 1,014 | 1,149 |
| 2013 | 1,132 | 931 | 1,317 | 1,382 | 1,617 | 1,460 | 1,613 | 1,544 | 1,542 | 1,270 | 1,553 | 1,290 |
| 2014 | 1,724 | 1,298 | 1,569 | 1,520 | 1,674 | 1,370 | 1,601 | 1,581 | 1,378 | 1,451 | 1,433 | 1,662 |
| 2015 | 1,252 | 1,289 | 1,302 | 1,416 | 1,678 | 1,142 | 1,693 | 1,259 | 1,236 | 1,682 | 1,375 | 1,490 |
| 2016 | 1,482 | 1,410 | 1,439 | 1,530 | 1,480 | 1,303 | 1,283 | 1,358 | 1,490 | 1,499 | 1,634 | 1,795 |
| 2017 | 1,608 | 1,794 | 1,594 | 1,815 | 1,750 | 1,718 | 1,612 | 1,541 | 1,489 | 1,634 | 1,279 | 1,525 |
| 2018 | 1,745 | 1,696 | 1,599 | 1,785 | 1,717 | 1,595 | 2,061 | 2,100 | 2,187 | 1,887 | 1,862 | 2,069 |
| 2019 | 2,006 | 1,633 | 2,040 | 1,763 | 1,571 | 1,539 | 1,711 | 1,961 | 1,380 | 1,552 | 1,430 | 1,406 |
| 2020 | 1,379 | 1,285 | 1,228 | 1,203 | 1,025 | 1,102 | 1,202 | 696 | 467 | 618 | 540 | 536 |
| 2021 | 502 | 461 | 679 | 705 | 1,080 | 1,017 | 1,116 | 1,147 | 1,118 | 1,219 | 1,172 | 1,189 |
| 2022 | 1,206 | 1,122 | 1,153 | 1,240 | 1,136 | 1,000 | 1,361 | 1,338 | 1,412 | 1,394 | 1,328 | 1,297 |
| 2023 | 1,377 | 1,323 | 1,372 | 1,357 | 1,225 | 589 | 569 | 695 | 1,145 | 1,181 | 1,425 | 1,615 |
| 2024 | 1,340 | 1,680 | 1,328 | 1,688 | ||||||||
| - = No Data Reported; -- = Not Applicable; NA = Not Available; W = Withheld to avoid disclosure of individual company data. |
| Release Date: 6/28/2024 |
| Next Release Date: 7/31/2024 |