|
Download Data (XLS File) |
|
||||||||
|
||||||||
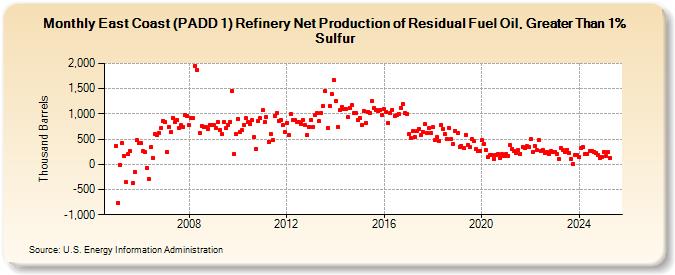
| East Coast (PADD 1) Refinery Net Production of Residual Fuel Oil, Greater Than 1% Sulfur (Thousand Barrels) | ||||||||
| Year | Jan | Feb | Mar | Apr | May | Jun | Jul | Aug | Sep | Oct | Nov | Dec |
|---|---|---|---|---|---|---|---|---|---|---|---|---|
| 2005 | 363 | -760 | -7 | 428 | 162 | -360 | 195 | 259 | -376 | -149 | 474 | 431 |
| 2006 | 415 | 254 | 248 | -65 | -282 | 339 | 133 | 599 | 574 | 622 | 712 | 863 |
| 2007 | 843 | 253 | 736 | 639 | 926 | 836 | 881 | 729 | 774 | 746 | 977 | 954 |
| 2008 | 775 | 922 | 916 | 1,952 | 1,871 | 630 | 760 | 746 | 743 | 697 | 788 | 783 |
| 2009 | 771 | 718 | 842 | 680 | 595 | 835 | 714 | 789 | 848 | 1,452 | 202 | 601 |
| 2010 | 900 | 649 | 674 | 784 | 909 | 842 | 803 | 869 | 533 | 310 | 852 | 909 |
| 2011 | 1,072 | 833 | 937 | 450 | 606 | 474 | 967 | 1,014 | 865 | 879 | 776 | 637 |
| 2012 | 820 | 574 | 997 | 873 | 880 | 849 | 835 | 805 | 881 | 775 | 580 | 745 |
| 2013 | 876 | 740 | 986 | 1,011 | 850 | 1,021 | 1,161 | 1,449 | 713 | 1,153 | 1,398 | 1,679 |
| 2014 | 1,257 | 744 | 1,069 | 1,130 | 1,091 | 1,101 | 931 | 1,121 | 1,171 | 1,015 | 1,010 | 875 |
| 2015 | 914 | 782 | 1,055 | 825 | 1,039 | 1,014 | 1,251 | 1,112 | 1,083 | 1,056 | 1,082 | 984 |
| 2016 | 1,094 | 1,033 | 823 | 1,021 | 1,084 | 963 | 969 | 1,005 | 1,119 | 1,201 | 1,017 | 1,002 |
| 2017 | 594 | 531 | 655 | 545 | 655 | 703 | 579 | 646 | 794 | 630 | 716 | 630 |
| 2018 | 732 | 481 | 532 | 459 | 776 | 696 | 597 | 495 | 718 | 503 | 402 | 661 |
| 2019 | 625 | 350 | 369 | 326 | 585 | 390 | 342 | 503 | 458 | 299 | 266 | 273 |
| 2020 | 476 | 403 | 290 | 143 | 176 | 189 | 112 | 184 | 203 | 131 | 196 | 160 |
| 2021 | 214 | 171 | 378 | 301 | 260 | 231 | 283 | 214 | 347 | 323 | 356 | 346 |
| 2022 | 496 | 236 | 366 | 277 | 475 | 273 | 292 | 225 | 248 | 203 | 266 | 249 |
| 2023 | 251 | 211 | 106 | 327 | 277 | 244 | 290 | 232 | 112 | 1 | 177 | 185 |
| 2024 | 137 | 318 | 338 | 201 | 205 | 272 | 266 | 237 | 216 | 179 | 132 | 151 |
| 2025 | 240 | 161 | 237 | 122 | ||||||||
| - = No Data Reported; -- = Not Applicable; NA = Not Available; W = Withheld to avoid disclosure of individual company data. |
| Release Date: 6/30/2025 |
| Next Release Date: 7/31/2025 |