|
Download Data (XLS File) |
|
||||||||
|
||||||||
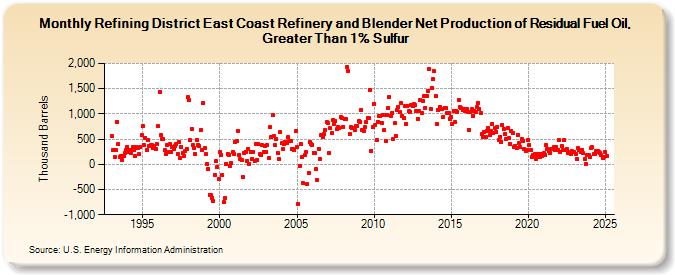
| Refining District East Coast Refinery and Blender Net Production of Residual Fuel Oil, Greater Than 1% Sulfur (Thousand Barrels) | ||||||||
| Year | Jan | Feb | Mar | Apr | May | Jun | Jul | Aug | Sep | Oct | Nov | Dec |
|---|---|---|---|---|---|---|---|---|---|---|---|---|
| 1993 | 553 | 282 | 137 | 277 | 844 | 403 | 145 | 171 | 79 | 174 | 226 | 282 |
| 1994 | 349 | 253 | 274 | 226 | 336 | 279 | 163 | 339 | 315 | 196 | 348 | 579 |
| 1995 | 752 | 374 | 525 | 283 | 482 | 361 | 377 | 377 | 322 | 368 | 310 | 400 |
| 1996 | 751 | 1,444 | 575 | 507 | 494 | 274 | 197 | 384 | 252 | 397 | 240 | 347 |
| 1997 | 299 | 368 | 401 | 209 | 450 | 126 | 347 | 233 | 160 | 261 | 308 | 1,328 |
| 1998 | 1,273 | 477 | 707 | 386 | 320 | 203 | 485 | 386 | 356 | 677 | 290 | 1,217 |
| 1999 | 314 | 204 | 10 | -95 | -602 | -614 | -660 | -733 | -209 | 61 | -50 | -289 |
| 2000 | 243 | 191 | -213 | -754 | -669 | 4 | 205 | 190 | -24 | 26 | 240 | 197 |
| 2001 | 433 | 464 | 666 | 194 | 101 | 78 | -247 | 232 | 249 | 67 | 305 | 11 |
| 2002 | 238 | 114 | 251 | 66 | 399 | 89 | 393 | 197 | 190 | 375 | 242 | 366 |
| 2003 | 251 | 376 | 124 | 731 | 540 | 975 | 556 | 374 | 502 | 218 | 104 | 636 |
| 2004 | 415 | 308 | 410 | 452 | 430 | 532 | 463 | 463 | 302 | 298 | 276 | 654 |
| 2005 | 340 | -781 | -32 | 409 | 143 | -376 | 178 | 242 | -393 | -168 | 451 | 403 |
| 2006 | 388 | 225 | 217 | -94 | -314 | 311 | 108 | 573 | 545 | 593 | 682 | 835 |
| 2007 | 814 | 229 | 713 | 619 | 882 | 801 | 851 | 695 | 745 | 729 | 948 | 923 |
| 2008 | 741 | 893 | 890 | 1,930 | 1,850 | 603 | 736 | 724 | 724 | 674 | 768 | 756 |
| 2009 | 858 | 849 | 1,085 | 676 | 663 | 731 | 832 | 925 | 913 | 1,481 | 267 | 739 |
| 2010 | 1,198 | 779 | 479 | 848 | 964 | 963 | 827 | 977 | 688 | 462 | 975 | 1,115 |
| 2011 | 1,335 | 964 | 1,020 | 511 | 812 | 571 | 1,068 | 1,138 | 1,034 | 1,218 | 957 | 914 |
| 2012 | 1,156 | 808 | 1,157 | 1,051 | 1,046 | 1,172 | 1,164 | 1,196 | 1,181 | 1,061 | 907 | 1,055 |
| 2013 | 1,280 | 1,026 | 1,259 | 1,347 | 1,124 | 1,347 | 1,462 | 1,885 | 1,101 | 1,523 | 1,687 | 1,844 |
| 2014 | 1,351 | 799 | 1,082 | 1,131 | 1,094 | 1,106 | 943 | 1,125 | 1,113 | 1,017 | 1,012 | 907 |
| 2015 | 931 | 800 | 1,062 | 834 | 1,053 | 1,034 | 1,277 | 1,128 | 1,109 | 1,077 | 1,100 | 1,050 |
| 2016 | 1,096 | 1,042 | 688 | 1,038 | 1,091 | 965 | 1,062 | 1,041 | 1,140 | 1,222 | 1,088 | 1,016 |
| 2017 | 592 | 537 | 634 | 543 | 653 | 713 | 579 | 653 | 807 | 629 | 721 | 643 |
| 2018 | 744 | 480 | 549 | 452 | 782 | 709 | 599 | 508 | 723 | 520 | 407 | 661 |
| 2019 | 624 | 353 | 370 | 327 | 589 | 414 | 342 | 503 | 466 | 299 | 268 | 275 |
| 2020 | 479 | 382 | 284 | 146 | 194 | 196 | 112 | 186 | 209 | 136 | 210 | 167 |
| 2021 | 218 | 186 | 383 | 311 | 268 | 230 | 295 | 307 | 334 | 291 | 339 | 288 |
| 2022 | 477 | 240 | 360 | 277 | 475 | 277 | 301 | 222 | 246 | 204 | 262 | 237 |
| 2023 | 250 | 200 | 107 | 327 | 277 | 248 | 290 | 221 | 102 | 1 | 177 | 185 |
| 2024 | 137 | 318 | 338 | 201 | 205 | 272 | 266 | 237 | 216 | 179 | 132 | 151 |
| 2025 | 239 | 161 | 237 | 125 | ||||||||
| - = No Data Reported; -- = Not Applicable; NA = Not Available; W = Withheld to avoid disclosure of individual company data. |
| Release Date: 6/30/2025 |
| Next Release Date: 7/31/2025 |