|
Download Data (XLS File) |
|
||||||||
|
||||||||
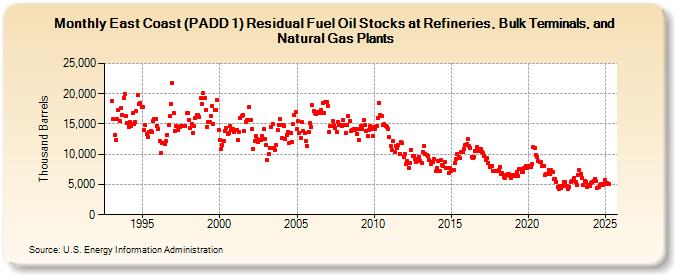
| East Coast (PADD 1) Residual Fuel Oil Stocks at Refineries, Bulk Terminals, and Natural Gas Plants (Thousand Barrels) | ||||||||
| Year | Jan | Feb | Mar | Apr | May | Jun | Jul | Aug | Sep | Oct | Nov | Dec |
|---|---|---|---|---|---|---|---|---|---|---|---|---|
| 1993 | 18,872 | 15,796 | 13,257 | 12,322 | 15,838 | 17,232 | 15,445 | 17,566 | 16,506 | 19,219 | 20,012 | 16,288 |
| 1994 | 15,189 | 14,552 | 15,356 | 14,668 | 16,814 | 14,960 | 15,330 | 17,083 | 19,777 | 18,243 | 18,549 | 17,788 |
| 1995 | 17,739 | 13,944 | 14,748 | 13,273 | 12,922 | 13,728 | 13,759 | 13,697 | 15,544 | 15,779 | 15,758 | 14,665 |
| 1996 | 14,242 | 12,168 | 10,159 | 11,910 | 11,773 | 11,766 | 12,138 | 13,260 | 14,775 | 16,266 | 18,287 | 21,780 |
| 1997 | 16,753 | 13,788 | 14,693 | 13,954 | 14,422 | 14,568 | 14,686 | 14,639 | 14,650 | 14,720 | 16,771 | 16,747 |
| 1998 | 15,736 | 14,272 | 14,915 | 13,588 | 14,622 | 16,059 | 16,460 | 16,505 | 16,165 | 19,255 | 18,234 | 20,062 |
| 1999 | 19,258 | 17,392 | 14,507 | 15,254 | 15,354 | 16,394 | 17,929 | 15,057 | 17,340 | 17,347 | 18,962 | 14,066 |
| 2000 | 12,405 | 10,850 | 11,511 | 12,190 | 13,836 | 14,332 | 13,313 | 13,452 | 14,706 | 14,052 | 14,209 | 13,660 |
| 2001 | 14,052 | 14,012 | 12,388 | 13,741 | 15,926 | 16,370 | 16,448 | 13,803 | 15,361 | 15,618 | 15,637 | 17,757 |
| 2002 | 15,684 | 14,203 | 10,886 | 12,210 | 13,014 | 12,538 | 12,029 | 12,325 | 12,371 | 12,951 | 14,129 | 12,527 |
| 2003 | 11,453 | 9,072 | 10,101 | 11,088 | 14,445 | 15,044 | 11,061 | 10,729 | 11,561 | 14,038 | 14,837 | 15,780 |
| 2004 | 12,671 | 14,788 | 14,700 | 12,545 | 13,223 | 13,716 | 11,780 | 13,548 | 11,972 | 15,004 | 16,404 | 17,020 |
| 2005 | 14,191 | 15,441 | 13,490 | 12,623 | 15,284 | 13,831 | 13,509 | 12,106 | 11,342 | 13,601 | 15,156 | 14,514 |
| 2006 | 18,082 | 17,141 | 16,817 | 16,601 | 17,032 | 16,968 | 16,822 | 17,292 | 18,412 | 16,765 | 18,550 | 18,667 |
| 2007 | 18,047 | 13,655 | 14,651 | 14,618 | 15,485 | 14,813 | 14,382 | 13,727 | 15,307 | 14,809 | 14,803 | 14,673 |
| 2008 | 15,667 | 14,911 | 13,457 | 14,817 | 16,252 | 15,423 | 13,779 | 13,990 | 14,105 | 14,077 | 14,150 | 13,261 |
| 2009 | 12,413 | 14,221 | 14,704 | 14,161 | 15,638 | 14,911 | 13,915 | 12,999 | 14,004 | 14,624 | 14,103 | 13,003 |
| 2010 | 14,459 | 14,240 | 14,623 | 15,907 | 18,487 | 16,419 | 16,275 | 14,783 | 14,924 | 14,646 | 14,483 | 14,175 |
| 2011 | 12,823 | 11,330 | 10,621 | 12,110 | 10,348 | 11,434 | 11,082 | 11,485 | 10,089 | 12,080 | 11,833 | 9,563 |
| 2012 | 9,961 | 8,406 | 8,919 | 7,774 | 8,520 | 10,777 | 9,687 | 9,693 | 9,181 | 8,695 | 9,144 | 9,532 |
| 2013 | 8,962 | 8,618 | 10,436 | 11,351 | 10,013 | 9,939 | 9,627 | 9,017 | 8,313 | 8,754 | 8,754 | 9,227 |
| 2014 | 7,152 | 7,739 | 8,891 | 7,229 | 8,980 | 8,188 | 7,996 | 8,712 | 7,804 | 7,772 | 6,872 | 7,723 |
| 2015 | 7,192 | 7,463 | 7,427 | 8,549 | 9,225 | 10,029 | 9,491 | 9,309 | 10,355 | 10,388 | 10,795 | 11,597 |
| 2016 | 11,644 | 12,496 | 11,430 | 11,086 | 9,556 | 9,415 | 9,511 | 10,494 | 11,244 | 10,558 | 10,493 | 10,924 |
| 2017 | 10,444 | 10,145 | 9,718 | 8,973 | 9,323 | 8,518 | 7,970 | 8,074 | 8,066 | 7,203 | 7,292 | 7,304 |
| 2018 | 7,263 | 7,315 | 7,873 | 6,797 | 6,865 | 6,244 | 6,091 | 6,557 | 6,801 | 6,684 | 6,445 | 6,033 |
| 2019 | 6,534 | 6,454 | 6,506 | 7,008 | 6,380 | 7,497 | 7,511 | 7,062 | 7,083 | 7,658 | 8,118 | 7,671 |
| 2020 | 8,083 | 8,103 | 7,873 | 8,458 | 11,119 | 10,980 | 9,861 | 9,588 | 8,843 | 8,643 | 8,682 | 8,014 |
| 2021 | 8,027 | 6,524 | 6,689 | 6,788 | 7,425 | 6,743 | 7,312 | 6,984 | 5,841 | 5,842 | 5,409 | 4,541 |
| 2022 | 4,254 | 4,702 | 4,467 | 4,828 | 5,352 | 5,416 | 4,692 | 4,177 | 4,618 | 5,464 | 5,624 | 5,611 |
| 2023 | 6,137 | 5,466 | 4,851 | 6,609 | 7,408 | 6,693 | 6,091 | 4,890 | 5,627 | 5,360 | 4,631 | 4,859 |
| 2024 | 4,686 | 5,182 | 5,373 | 5,531 | 5,925 | 5,542 | 4,480 | 4,526 | 4,946 | 5,070 | 4,870 | 5,156 |
| 2025 | 5,745 | 5,211 | 5,049 | 5,007 | ||||||||
| - = No Data Reported; -- = Not Applicable; NA = Not Available; W = Withheld to avoid disclosure of individual company data. |
| Release Date: 6/30/2025 |
| Next Release Date: 7/31/2025 |