|
Download Data (XLS File) |
|
||||||||
|
||||||||
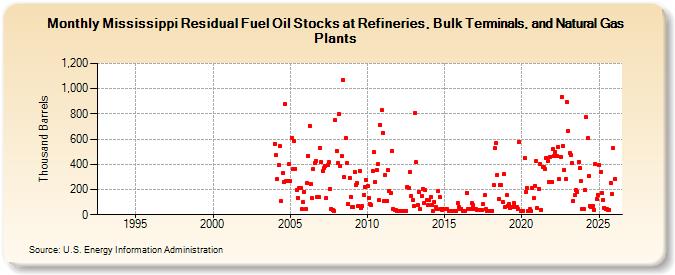
| Mississippi Residual Fuel Oil Stocks at Refineries, Bulk Terminals, and Natural Gas Plants (Thousand Barrels) | ||||||||
| Year | Jan | Feb | Mar | Apr | May | Jun | Jul | Aug | Sep | Oct | Nov | Dec |
|---|---|---|---|---|---|---|---|---|---|---|---|---|
| 1993 | W | W | W | W | W | W | W | W | W | W | W | W |
| 1994 | W | W | W | W | W | W | W | W | W | W | W | W |
| 1995 | W | W | W | W | W | W | W | W | W | W | W | W |
| 1996 | W | W | W | W | W | W | W | W | W | W | W | W |
| 1997 | W | W | W | W | W | W | W | W | W | W | W | W |
| 1998 | W | W | W | W | W | W | W | W | W | W | W | W |
| 1999 | W | W | W | W | W | W | W | W | W | W | W | W |
| 2000 | W | W | W | W | W | W | W | W | W | W | W | W |
| 2001 | W | W | W | W | W | W | W | W | W | W | W | W |
| 2002 | W | W | W | W | W | W | W | W | W | W | W | W |
| 2003 | W | W | W | W | W | W | W | W | W | W | W | W |
| 2004 | 565 | 470 | 283 | 396 | 542 | 106 | 330 | 258 | 876 | 266 | 269 | 404 |
| 2005 | 265 | 612 | 362 | 582 | 366 | 197 | 136 | 213 | 213 | 43 | 99 | 182 |
| 2006 | 47 | 248 | 469 | 707 | 246 | 133 | 360 | 410 | 429 | 142 | 142 | 532 |
| 2007 | 420 | 343 | 367 | 386 | 135 | 392 | 415 | 203 | 48 | 40 | 32 | 748 |
| 2008 | 508 | 408 | 800 | 386 | 466 | 1,072 | 297 | 606 | 410 | 86 | 295 | 141 |
| 2009 | 58 | 62 | 342 | 236 | 250 | 72 | 348 | 54 | 67 | 158 | 223 | 279 |
| 2010 | 231 | 131 | 86 | 75 | 345 | 497 | 260 | 355 | 399 | 115 | 715 | 828 |
| 2011 | 649 | 111 | 315 | 111 | 353 | 190 | 172 | 504 | 49 | 40 | 37 | 32 |
| 2012 | 32 | 32 | 32 | 32 | 32 | 32 | 32 | 222 | 214 | 340 | 149 | 113 |
| 2013 | 73 | 810 | 416 | 79 | 184 | 43 | 149 | 207 | 93 | 194 | 118 | 76 |
| 2014 | 115 | 142 | 79 | 32 | 101 | 64 | 45 | 185 | 144 | 49 | 41 | 42 |
| 2015 | 42 | 44 | 45 | 32 | 32 | 32 | 32 | 32 | 32 | 32 | 89 | 61 |
| 2016 | 47 | 48 | 32 | 32 | 32 | 175 | 47 | 44 | 44 | 89 | 75 | 46 |
| 2017 | 47 | 38 | 38 | 38 | 38 | 38 | 83 | 153 | 43 | 32 | 32 | 32 |
| 2018 | 32 | 32 | 235 | 526 | 569 | 317 | 127 | 237 | 237 | 101 | 320 | 61 |
| 2019 | 153 | 70 | 86 | 51 | 58 | 59 | 91 | 60 | 62 | 46 | 579 | 32 |
| 2020 | 32 | 32 | 450 | 182 | 212 | 32 | 42 | 32 | 210 | 129 | 226 | 428 |
| 2021 | 51 | 208 | 403 | 40 | 378 | 377 | 363 | 452 | 430 | 263 | 460 | 260 |
| 2022 | 520 | 464 | 501 | 464 | 540 | 282 | 461 | 937 | 544 | 357 | 283 | 894 |
| 2023 | 665 | 486 | 471 | 408 | 110 | 154 | 193 | 183 | 420 | 370 | 264 | 48 |
| 2024 | 47 | 194 | 772 | 606 | ||||||||
| - = No Data Reported; -- = Not Applicable; NA = Not Available; W = Withheld to avoid disclosure of individual company data. |
| Release Date: 6/28/2024 |
| Next Release Date: 7/31/2024 |