|
Download Data (XLS File) |
|
||||||||
|
||||||||
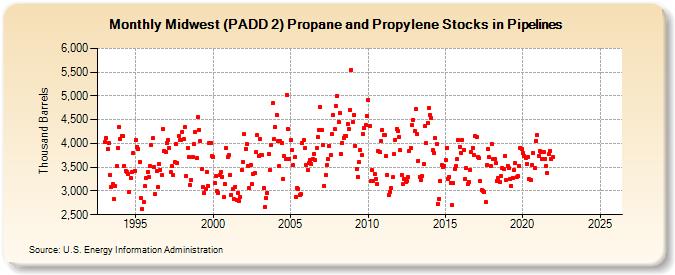
| Midwest (PADD 2) Propane and Propylene Stocks in Pipelines (Thousand Barrels) | ||||||||
| Year | Jan | Feb | Mar | Apr | May | Jun | Jul | Aug | Sep | Oct | Nov | Dec |
|---|---|---|---|---|---|---|---|---|---|---|---|---|
| 1993 | 4,023 | 4,118 | 3,876 | 4,004 | 3,344 | 3,091 | 3,147 | 2,828 | 3,114 | 3,533 | 3,908 | 4,355 |
| 1994 | 4,102 | 4,166 | 4,155 | 3,530 | 3,425 | 3,395 | 3,360 | 2,975 | 3,264 | 3,405 | 3,809 | 3,423 |
| 1995 | 4,075 | 3,933 | 3,887 | 3,602 | 2,846 | 2,620 | 2,774 | 3,094 | 3,278 | 3,404 | 3,286 | 3,522 |
| 1996 | 3,965 | 4,105 | 3,503 | 2,926 | 3,415 | 3,079 | 3,573 | 3,449 | 3,331 | 4,299 | 3,847 | 3,817 |
| 1997 | 4,009 | 4,073 | 3,906 | 3,392 | 3,517 | 3,329 | 3,603 | 3,979 | 3,597 | 4,164 | 4,063 | 4,062 |
| 1998 | 4,248 | 4,085 | 4,341 | 3,314 | 3,896 | 3,708 | 3,122 | 3,238 | 3,720 | 3,988 | 4,245 | 3,684 |
| 1999 | 4,549 | 4,283 | 4,046 | 3,456 | 3,087 | 2,962 | 3,034 | 3,408 | 3,112 | 4,012 | 4,009 | 3,727 |
| 2000 | 3,717 | 3,167 | 3,309 | 2,993 | 2,957 | 3,344 | 3,403 | 3,299 | 2,867 | 3,144 | 3,906 | 3,721 |
| 2001 | 3,753 | 3,345 | 2,913 | 3,041 | 2,833 | 3,090 | 2,812 | 2,965 | 2,786 | 2,876 | 3,443 | 3,613 |
| 2002 | 4,193 | 3,889 | 3,985 | 3,523 | 3,052 | 3,556 | 3,145 | 3,365 | 3,369 | 3,814 | 4,168 | 3,742 |
| 2003 | 4,092 | 3,765 | 3,748 | 3,062 | 2,668 | 2,850 | 2,967 | 3,781 | 3,433 | 3,964 | 4,845 | 4,085 |
| 2004 | 4,344 | 4,601 | 4,049 | 3,520 | 4,047 | 4,002 | 3,257 | 3,734 | 3,672 | 5,014 | 4,311 | 3,678 |
| 2005 | 4,072 | 3,867 | 3,545 | 3,704 | 2,882 | 3,068 | 3,043 | 2,919 | 2,929 | 4,015 | 4,072 | 3,894 |
| 2006 | 3,548 | 3,431 | 3,579 | 3,655 | 3,570 | 3,678 | 3,784 | 3,651 | 3,896 | 4,135 | 4,291 | 4,766 |
| 2007 | 4,286 | 3,964 | 3,112 | 3,338 | 3,537 | 3,662 | 3,953 | 3,767 | 4,199 | 4,602 | 4,297 | 4,795 |
| 2008 | 4,988 | 4,453 | 4,636 | 3,785 | 4,014 | 4,120 | 4,155 | 4,159 | 4,403 | 4,304 | 4,714 | 5,553 |
| 2009 | 4,446 | 4,603 | 3,948 | 3,466 | 3,300 | 3,614 | 3,862 | 3,754 | 4,202 | 4,321 | 4,385 | 4,587 |
| 2010 | 4,909 | 4,373 | 3,205 | 3,435 | 3,218 | 3,367 | 3,255 | 3,156 | 3,836 | 3,812 | 4,044 | 4,280 |
| 2011 | 4,176 | 4,169 | 3,733 | 3,341 | 2,910 | 2,980 | 3,052 | 3,285 | 3,772 | 4,081 | 4,311 | 4,260 |
| 2012 | 4,141 | 3,854 | 3,341 | 3,141 | 3,259 | 3,190 | 3,209 | 3,294 | 3,840 | 3,911 | 4,384 | 4,498 |
| 2013 | 4,261 | 4,718 | 4,193 | 3,639 | 3,300 | 3,238 | 3,312 | 3,572 | 4,357 | 4,000 | 4,432 | 4,751 |
| 2014 | 4,601 | 4,533 | 3,854 | 3,791 | 4,111 | 3,995 | 2,735 | 2,841 | 3,217 | 3,541 | 3,506 | 3,526 |
| 2015 | 3,655 | 3,913 | 3,249 | 3,303 | 3,174 | 2,697 | 3,164 | 3,471 | 3,525 | 3,667 | 4,074 | 3,934 |
| 2016 | 3,794 | 4,068 | 3,864 | 3,245 | 3,474 | 3,149 | 3,195 | 3,451 | 3,818 | 3,911 | 3,765 | 4,146 |
| 2017 | 4,128 | 3,723 | 3,693 | 3,199 | 3,017 | 3,005 | 2,984 | 2,758 | 3,553 | 3,890 | 3,708 | 3,525 |
| 2018 | 3,989 | 3,681 | 3,670 | 3,579 | 3,201 | 3,280 | 3,186 | 3,317 | 3,477 | 3,463 | 3,745 | 3,230 |
| 2019 | 3,532 | 3,477 | 3,248 | 3,111 | 3,280 | 3,439 | 3,580 | 3,284 | 3,312 | 3,531 | 3,900 | 3,883 |
| 2020 | 3,806 | 3,738 | 3,691 | 3,568 | 3,722 | 3,242 | 3,231 | 3,548 | 3,798 | 3,491 | 4,051 | 4,179 |
| 2021 | 3,734 | 3,835 | 3,823 | 3,678 | 3,810 | 3,676 | 3,532 | 3,378 | 3,771 | 3,838 | 3,677 | 3,711 |
| 2022 | -- | -- | -- | -- | -- | -- | -- | -- | -- | -- | -- | -- |
| 2023 | -- | -- | -- | -- | -- | -- | -- | -- | -- | -- | -- | -- |
| 2024 | -- | -- | -- | -- | ||||||||
| - = No Data Reported; -- = Not Applicable; NA = Not Available; W = Withheld to avoid disclosure of individual company data. |
| Release Date: 6/28/2024 |
| Next Release Date: 7/31/2024 |