|
Download Data (XLS File) |
|
||||||||
|
||||||||
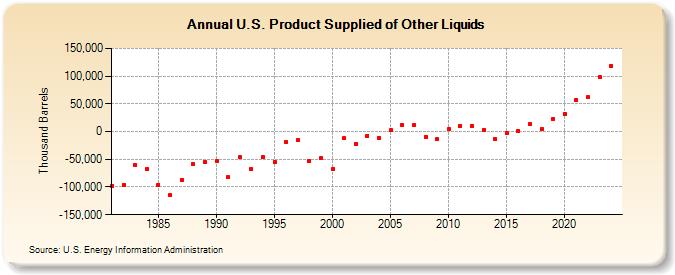
| U.S. Product Supplied of Other Liquids (Thousand Barrels) | ||||||||
| Decade | Year-0 | Year-1 | Year-2 | Year-3 | Year-4 | Year-5 | Year-6 | Year-7 | Year-8 | Year-9 |
|---|---|---|---|---|---|---|---|---|---|---|
| 1980's | -98,214 | -95,510 | -60,461 | -67,960 | -95,796 | -114,542 | -86,692 | -59,071 | -55,177 | |
| 1990's | -53,072 | -82,242 | -46,476 | -67,955 | -46,728 | -54,042 | -17,994 | -15,867 | -53,103 | -48,160 |
| 2000's | -68,111 | -11,745 | -21,803 | -7,172 | -10,867 | 2,127 | 12,202 | 11,544 | -9,203 | -13,512 |
| 2010's | 4,752 | 9,637 | 10,314 | 2,794 | -13,863 | -3,123 | 1,415 | 13,072 | 4,990 | 23,097 |
| 2020's | 32,553 | 56,770 | 61,707 | 97,486 |
| - = No Data Reported; -- = Not Applicable; NA = Not Available; W = Withheld to avoid disclosure of individual company data. |
| Release Date: 3/29/2024 |
| Next Release Date: 8/30/2024 |