|
Download Data (XLS File) |
|
||||||||
|
||||||||
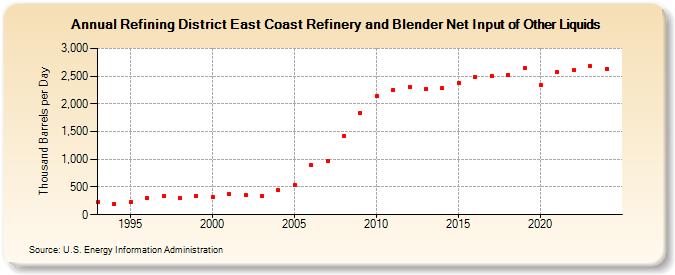
| Refining District East Coast Refinery and Blender Net Input of Other Liquids (Thousand Barrels per Day) | ||||||||
| Decade | Year-0 | Year-1 | Year-2 | Year-3 | Year-4 | Year-5 | Year-6 | Year-7 | Year-8 | Year-9 |
|---|---|---|---|---|---|---|---|---|---|---|
| 1990's | 229 | 201 | 227 | 298 | 331 | 301 | 338 | |||
| 2000's | 319 | 374 | 353 | 340 | 444 | 539 | 894 | 972 | 1,420 | 1,835 |
| 2010's | 2,140 | 2,246 | 2,310 | 2,275 | 2,284 | 2,377 | 2,489 | 2,507 | 2,523 | 2,640 |
| 2020's | 2,339 | 2,575 | 2,617 | 2,680 |
| - = No Data Reported; -- = Not Applicable; NA = Not Available; W = Withheld to avoid disclosure of individual company data. |
| Release Date: 6/28/2024 |
| Next Release Date: 8/30/2024 |