|
Download Data (XLS File) |
|
||||||||
|
||||||||
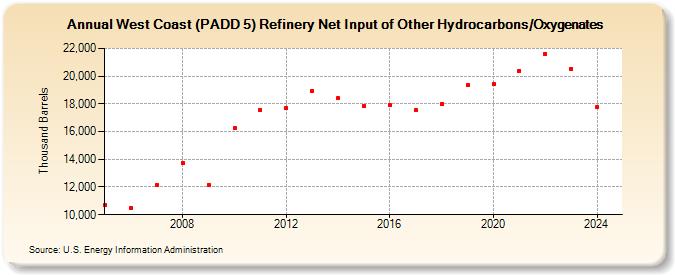
| West Coast (PADD 5) Refinery Net Input of Other Hydrocarbons/Oxygenates (Thousand Barrels) | ||||||||
| Decade | Year-0 | Year-1 | Year-2 | Year-3 | Year-4 | Year-5 | Year-6 | Year-7 | Year-8 | Year-9 |
|---|---|---|---|---|---|---|---|---|---|---|
| 2000's | 10,697 | 10,491 | 12,161 | 13,735 | 12,175 | |||||
| 2010's | 16,251 | 17,584 | 17,701 | 18,952 | 18,390 | 17,867 | 17,907 | 17,529 | 18,023 | 19,349 |
| 2020's | 19,445 | 20,388 | 21,623 | 20,536 | 17,751 |
| - = No Data Reported; -- = Not Applicable; NA = Not Available; W = Withheld to avoid disclosure of individual company data. |
| Release Date: 6/30/2025 |
| Next Release Date: 8/29/2025 |