|
Download Data (XLS File) |
|
||||||||
|
||||||||
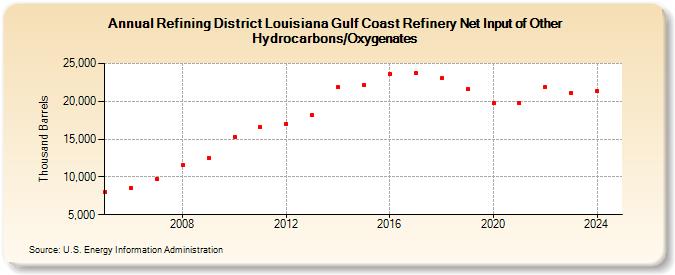
| Refining District Louisiana Gulf Coast Refinery Net Input of Other Hydrocarbons/Oxygenates (Thousand Barrels) | ||||||||
| Decade | Year-0 | Year-1 | Year-2 | Year-3 | Year-4 | Year-5 | Year-6 | Year-7 | Year-8 | Year-9 |
|---|---|---|---|---|---|---|---|---|---|---|
| 2000's | 8,001 | 8,577 | 9,745 | 11,529 | 12,551 | |||||
| 2010's | 15,293 | 16,604 | 17,014 | 18,147 | 21,846 | 22,154 | 23,627 | 23,720 | 23,021 | 21,637 |
| 2020's | 19,760 | 19,768 | 21,866 | 21,111 |
| - = No Data Reported; -- = Not Applicable; NA = Not Available; W = Withheld to avoid disclosure of individual company data. |
| Release Date: 8/30/2024 |
| Next Release Date: 8/29/2025 |