|
Download Data (XLS File) |
|
||||||||
|
||||||||
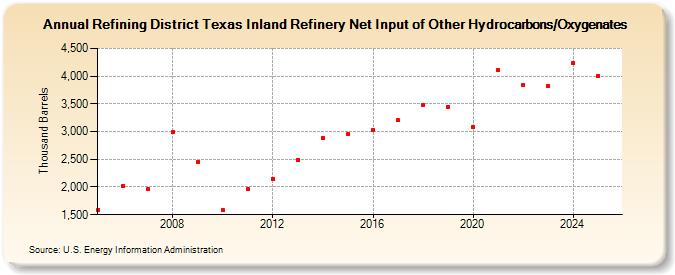
| Refining District Texas Inland Refinery Net Input of Other Hydrocarbons/Oxygenates (Thousand Barrels) | ||||||||
| Decade | Year-0 | Year-1 | Year-2 | Year-3 | Year-4 | Year-5 | Year-6 | Year-7 | Year-8 | Year-9 |
|---|---|---|---|---|---|---|---|---|---|---|
| 2000's | 1,589 | 2,020 | 1,955 | 2,998 | 2,457 | |||||
| 2010's | 1,581 | 1,958 | 2,153 | 2,492 | 2,884 | 2,958 | 3,027 | 3,201 | 3,486 | 3,446 |
| 2020's | 3,087 | 4,106 | 3,833 | 3,820 |
| - = No Data Reported; -- = Not Applicable; NA = Not Available; W = Withheld to avoid disclosure of individual company data. |
| Release Date: 3/29/2024 |
| Next Release Date: 8/30/2024 |