|
Download Data (XLS File) |
|
||||||||
|
||||||||
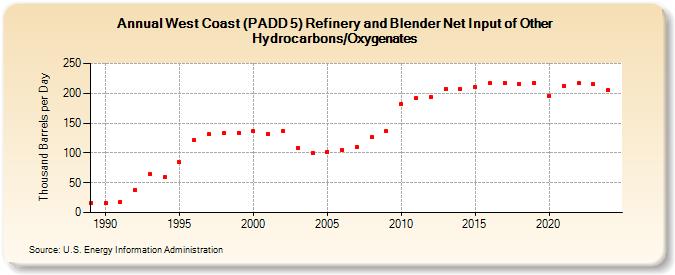
| West Coast (PADD 5) Refinery and Blender Net Input of Other Hydrocarbons/Oxygenates (Thousand Barrels per Day) | ||||||||
| Decade | Year-0 | Year-1 | Year-2 | Year-3 | Year-4 | Year-5 | Year-6 | Year-7 | Year-8 | Year-9 |
|---|---|---|---|---|---|---|---|---|---|---|
| 1980's | 16 | |||||||||
| 1990's | 16 | 18 | 38 | 64 | 59 | 84 | 121 | 131 | 133 | 134 |
| 2000's | 136 | 132 | 137 | 109 | 100 | 102 | 105 | 110 | 126 | 136 |
| 2010's | 182 | 192 | 193 | 208 | 207 | 210 | 217 | 218 | 216 | 218 |
| 2020's | 196 | 213 | 217 | 215 |
| - = No Data Reported; -- = Not Applicable; NA = Not Available; W = Withheld to avoid disclosure of individual company data. |
| Release Date: 6/28/2024 |
| Next Release Date: 8/30/2024 |