|
Download Data (XLS File) |
|
||||||||
|
||||||||
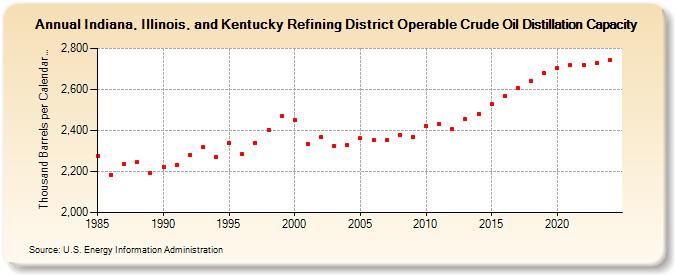
| Indiana, Illinois, and Kentucky Refining District Operable Crude Oil Distillation Capacity (Thousand Barrels per Calendar Day) | ||||||||
| Decade | Year-0 | Year-1 | Year-2 | Year-3 | Year-4 | Year-5 | Year-6 | Year-7 | Year-8 | Year-9 |
|---|---|---|---|---|---|---|---|---|---|---|
| 1980's | 2,278 | 2,185 | 2,235 | 2,245 | 2,193 | |||||
| 1990's | 2,224 | 2,230 | 2,282 | 2,318 | 2,269 | 2,339 | 2,285 | 2,341 | 2,404 | 2,469 |
| 2000's | 2,450 | 2,336 | 2,366 | 2,324 | 2,327 | 2,362 | 2,355 | 2,354 | 2,379 | 2,370 |
| 2010's | 2,422 | 2,433 | 2,405 | 2,454 | 2,480 | 2,527 | 2,568 | 2,607 | 2,640 | 2,678 |
| 2020's | 2,703 | 2,717 | 2,721 | 2,730 |
| - = No Data Reported; -- = Not Applicable; NA = Not Available; W = Withheld to avoid disclosure of individual company data. |
| Release Date: 4/30/2024 |
| Next Release Date: 8/30/2024 |