|
Download Data (XLS File) |
|
||||||||
|
||||||||
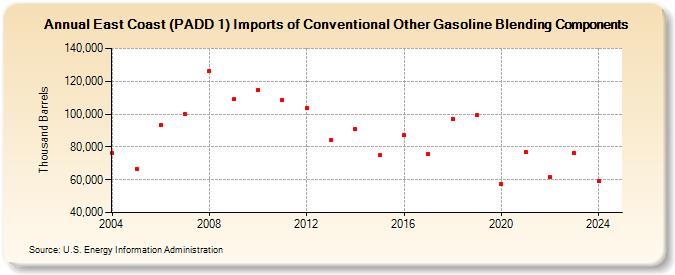
| East Coast (PADD 1) Imports of Conventional Other Gasoline Blending Components (Thousand Barrels) | ||||||||
| Decade | Year-0 | Year-1 | Year-2 | Year-3 | Year-4 | Year-5 | Year-6 | Year-7 | Year-8 | Year-9 |
|---|---|---|---|---|---|---|---|---|---|---|
| 2000's | 76,020 | 66,658 | 93,259 | 99,776 | 126,231 | 109,010 | ||||
| 2010's | 114,829 | 108,755 | 103,405 | 83,970 | 90,748 | 74,900 | 86,942 | 75,691 | 97,095 | 99,228 |
| 2020's | 57,254 | 76,848 | 61,725 | 76,282 |
| - = No Data Reported; -- = Not Applicable; NA = Not Available; W = Withheld to avoid disclosure of individual company data. |
| Release Date: 3/29/2024 |
| Next Release Date: 8/30/2024 |