|
Download Data (XLS File) |
|
||||||||
|
||||||||
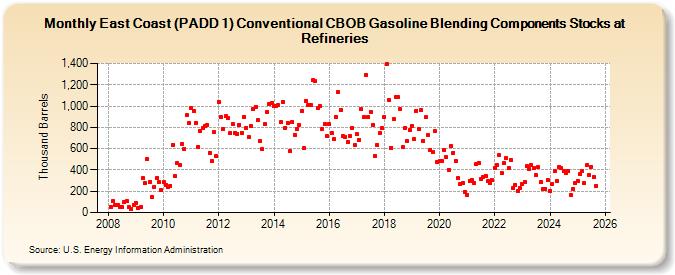
| East Coast (PADD 1) Conventional CBOB Gasoline Blending Components Stocks at Refineries (Thousand Barrels) | ||||||||
| Year | Jan | Feb | Mar | Apr | May | Jun | Jul | Aug | Sep | Oct | Nov | Dec |
|---|---|---|---|---|---|---|---|---|---|---|---|---|
| 2008 | 54 | 108 | 73 | 75 | 56 | 52 | 102 | 108 | 50 | 37 | 75 | |
| 2009 | 93 | 45 | 51 | 322 | 274 | 499 | 290 | 147 | 239 | 320 | 289 | 208 |
| 2010 | 283 | 263 | 241 | 252 | 638 | 343 | 462 | 449 | 644 | 598 | 912 | 837 |
| 2011 | 986 | 952 | 844 | 616 | 766 | 792 | 815 | 821 | 562 | 487 | 754 | 531 |
| 2012 | 1,042 | 895 | 786 | 903 | 887 | 746 | 836 | 747 | 738 | 826 | 750 | 902 |
| 2013 | 796 | 709 | 813 | 971 | 996 | 869 | 668 | 596 | 828 | 944 | 1,019 | 1,031 |
| 2014 | 999 | 999 | 1,008 | 847 | 1,042 | 798 | 842 | 575 | 852 | 729 | 784 | 821 |
| 2015 | 956 | 604 | 1,050 | 1,011 | 1,010 | 1,241 | 1,234 | 979 | 1,002 | 786 | 835 | 719 |
| 2016 | 829 | 744 | 688 | 902 | 1,129 | 965 | 718 | 708 | 666 | 721 | 796 | 631 |
| 2017 | 735 | 682 | 970 | 895 | 1,292 | 896 | 945 | 826 | 531 | 637 | 745 | 792 |
| 2018 | 893 | 1,395 | 1,055 | 610 | 875 | 1,083 | 1,086 | 972 | 611 | 795 | 671 | 777 |
| 2019 | 812 | 689 | 957 | 782 | 962 | 673 | 895 | 724 | 591 | 565 | 763 | 473 |
| 2020 | 480 | 487 | 589 | 519 | 404 | 625 | 562 | 484 | 322 | 264 | 277 | 196 |
| 2021 | 166 | 299 | 307 | 281 | 457 | 469 | 318 | 334 | 346 | 296 | 276 | 302 |
| 2022 | 420 | 447 | 537 | 372 | 467 | 512 | 419 | 498 | 229 | 262 | 206 | 229 |
| 2023 | 269 | 285 | 434 | 407 | 443 | 421 | 349 | 425 | 288 | 222 | 223 | 302 |
| 2024 | 205 | 266 | 394 | 295 | ||||||||
| - = No Data Reported; -- = Not Applicable; NA = Not Available; W = Withheld to avoid disclosure of individual company data. |
| Release Date: 6/28/2024 |
| Next Release Date: 7/31/2024 |