|
Download Data (XLS File) |
|
||||||||
|
||||||||
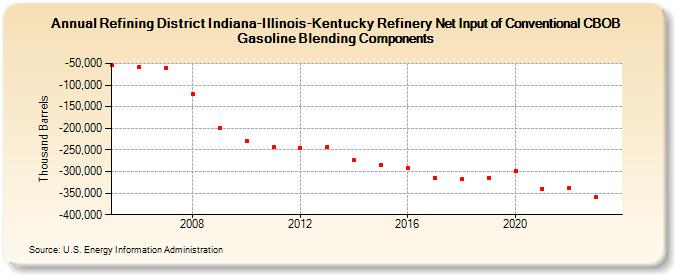
| Refining District Indiana-Illinois-Kentucky Refinery Net Input of Conventional CBOB Gasoline Blending Components (Thousand Barrels) | ||||||||
| Decade | Year-0 | Year-1 | Year-2 | Year-3 | Year-4 | Year-5 | Year-6 | Year-7 | Year-8 | Year-9 |
|---|---|---|---|---|---|---|---|---|---|---|
| 2000's | -53,631 | -57,998 | -60,335 | -121,692 | -198,908 | |||||
| 2010's | -229,361 | -243,415 | -245,989 | -242,668 | -274,113 | -284,455 | -292,333 | -314,125 | -318,213 | -314,505 |
| 2020's | -299,861 | -339,880 | -338,040 | -359,911 |
| - = No Data Reported; -- = Not Applicable; NA = Not Available; W = Withheld to avoid disclosure of individual company data. |
| Release Date: 3/29/2024 |
| Next Release Date: 8/30/2024 |