|
Download Data (XLS File) |
|
||||||||
|
||||||||
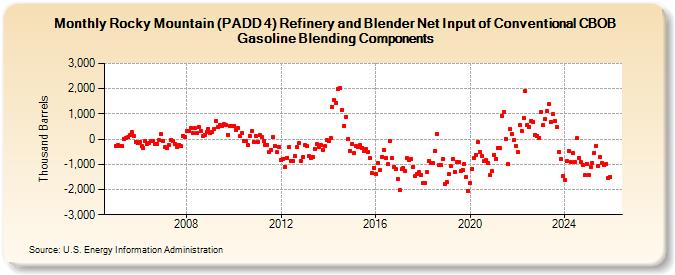
| Rocky Mountain (PADD 4) Refinery and Blender Net Input of Conventional CBOB Gasoline Blending Components (Thousand Barrels) | ||||||||
| Year | Jan | Feb | Mar | Apr | May | Jun | Jul | Aug | Sep | Oct | Nov | Dec |
|---|---|---|---|---|---|---|---|---|---|---|---|---|
| 2005 | -281 | -235 | -268 | -293 | 10 | 60 | 74 | 144 | 288 | 136 | -101 | -155 |
| 2006 | -107 | -267 | -363 | -66 | -200 | -138 | -95 | -86 | -180 | -201 | -38 | 191 |
| 2007 | -94 | -305 | -350 | -216 | -17 | -92 | -185 | -328 | -225 | -291 | 133 | 94 |
| 2008 | 323 | 305 | 423 | 226 | 421 | 238 | 489 | 330 | 105 | 169 | 287 | 402 |
| 2009 | 243 | 297 | 406 | 729 | 487 | 552 | 524 | 597 | 552 | 178 | 521 | 523 |
| 2010 | 531 | 369 | 448 | 106 | 228 | -59 | -67 | -246 | 128 | 328 | -111 | 122 |
| 2011 | -105 | 154 | 71 | -72 | -227 | -219 | -516 | -428 | 79 | -280 | -523 | -314 |
| 2012 | -848 | -771 | -1,099 | -733 | -330 | -864 | -855 | -682 | -329 | -169 | -863 | -720 |
| 2013 | -252 | -282 | -668 | -745 | -698 | -398 | -205 | -312 | -233 | -434 | -285 | -52 |
| 2014 | -74 | 53 | 1,293 | 1,542 | 1,434 | 1,997 | 2,016 | 1,164 | 532 | 880 | 13 | -465 |
| 2015 | -188 | -564 | -275 | -306 | -228 | -339 | -463 | -383 | -500 | -753 | -1,361 | -1,131 |
| 2016 | -1,387 | -932 | -1,234 | -702 | -426 | -731 | -1,007 | -60 | -745 | -1,116 | -1,194 | -1,567 |
| 2017 | -2,032 | -1,196 | -1,149 | -1,272 | -760 | -834 | -781 | -1,092 | -1,459 | -1,404 | -1,320 | -1,406 |
| 2018 | -1,735 | -1,742 | -1,319 | -858 | -944 | -958 | -459 | 206 | -1,025 | -1,012 | -771 | -1,797 |
| 2019 | -1,721 | -1,400 | -1,083 | -807 | -1,290 | -904 | -926 | -1,275 | -1,209 | -988 | -1,508 | -2,044 |
| 2020 | -1,723 | -1,183 | -739 | -634 | -109 | -523 | -682 | -888 | -838 | -958 | -1,444 | -1,266 |
| 2021 | -614 | -770 | -359 | -367 | 923 | 1,067 | 20 | -994 | 391 | 199 | -27 | -258 |
| 2022 | -529 | 545 | 338 | 853 | 1,910 | 576 | 484 | 723 | 689 | 181 | 131 | 57 |
| 2023 | 910 | 410 | 621 | 1,118 | 1,381 | 974 | 978 | 736 | 492 | -496 | -785 | -1,521 |
| 2024 | -1,658 | |||||||||||
| - = No Data Reported; -- = Not Applicable; NA = Not Available; W = Withheld to avoid disclosure of individual company data. |
| Release Date: 3/29/2024 |
| Next Release Date: 4/30/2024 |