|
Download Data (XLS File) |
|
||||||||
|
||||||||
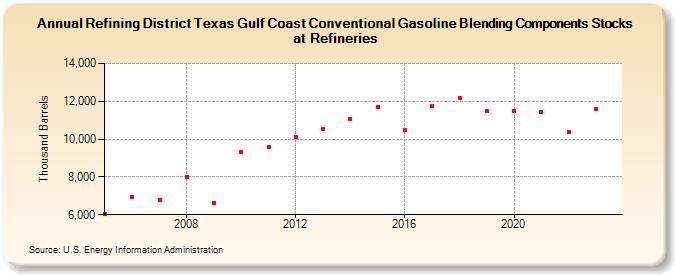
| Refining District Texas Gulf Coast Conventional Gasoline Blending Components Stocks at Refineries (Thousand Barrels) | ||||||||
| Decade | Year-0 | Year-1 | Year-2 | Year-3 | Year-4 | Year-5 | Year-6 | Year-7 | Year-8 | Year-9 |
|---|---|---|---|---|---|---|---|---|---|---|
| 2000's | 6,042 | 6,927 | 6,757 | 8,001 | 6,624 | |||||
| 2010's | 9,297 | 9,576 | 10,112 | 10,535 | 11,055 | 11,716 | 10,464 | 11,753 | 12,152 | 11,469 |
| 2020's | 11,463 | 11,442 | 10,363 | 11,600 |
| - = No Data Reported; -- = Not Applicable; NA = Not Available; W = Withheld to avoid disclosure of individual company data. |
| Release Date: 8/30/2024 |
| Next Release Date: 8/29/2025 |