|
Download Data (XLS File) |
|
||||||||
|
||||||||
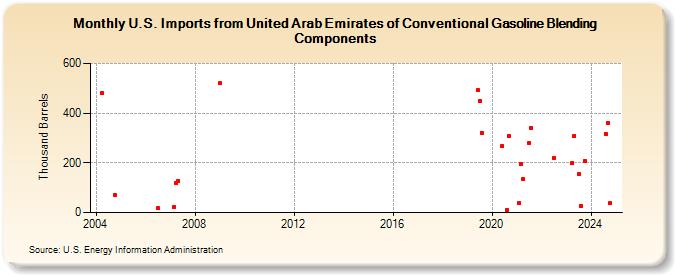
| U.S. Imports from United Arab Emirates of Conventional Gasoline Blending Components (Thousand Barrels) | ||||||||
| Year | Jan | Feb | Mar | Apr | May | Jun | Jul | Aug | Sep | Oct | Nov | Dec |
|---|---|---|---|---|---|---|---|---|---|---|---|---|
| 2004 | 481 | 72 | ||||||||||
| 2006 | 17 | |||||||||||
| 2007 | 22 | 119 | 129 | |||||||||
| 2009 | 520 | |||||||||||
| 2019 | 492 | 451 | 321 | |||||||||
| 2020 | 268 | 10 | 309 | |||||||||
| 2021 | 38 | 194 | 135 | 281 | 341 | |||||||
| 2022 | 221 | |||||||||||
| 2023 | 200 | 310 | 154 | 27 | 209 | |||||||
| - = No Data Reported; -- = Not Applicable; NA = Not Available; W = Withheld to avoid disclosure of individual company data. |
| Release Date: 8/30/2024 |
| Next Release Date: 9/30/2024 |