|
Download Data (XLS File) |
|
||||||||
|
||||||||
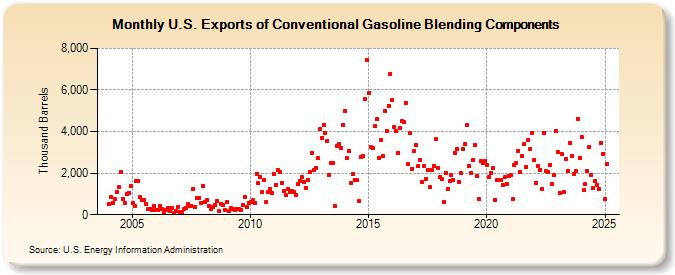
| U.S. Exports of Conventional Gasoline Blending Components (Thousand Barrels) | ||||||||
| Year | Jan | Feb | Mar | Apr | May | Jun | Jul | Aug | Sep | Oct | Nov | Dec |
|---|---|---|---|---|---|---|---|---|---|---|---|---|
| 2004 | 500 | 830 | 572 | 752 | 1,105 | 1,311 | 2,061 | 778 | 577 | 985 | 1,055 | 1,367 |
| 2005 | 554 | 413 | 1,602 | 1,645 | 828 | 685 | 688 | 529 | 256 | 296 | 207 | 441 |
| 2006 | 245 | 211 | 417 | 271 | 99 | 215 | 341 | 164 | 314 | 60 | 165 | 394 |
| 2007 | 113 | 123 | 267 | 340 | 502 | 429 | 434 | 1,256 | 360 | 806 | 825 | 578 |
| 2008 | 1,399 | 597 | 694 | 422 | 285 | 376 | 461 | 654 | 159 | 493 | 491 | 219 |
| 2009 | 627 | 156 | 317 | 277 | 230 | 283 | 275 | 243 | 459 | 857 | 372 | 576 |
| 2010 | 621 | 687 | 579 | 1,974 | 1,511 | 1,812 | 1,095 | 1,673 | 591 | 1,098 | 1,232 | 1,034 |
| 2011 | 1,935 | 1,450 | 2,162 | 2,053 | 1,531 | 1,132 | 932 | 1,234 | 1,080 | 1,164 | 1,084 | 958 |
| 2012 | 1,489 | 1,627 | 1,796 | 1,586 | 1,267 | 1,688 | 2,059 | 2,991 | 2,174 | 2,240 | 2,711 | 4,100 |
| 2013 | 3,699 | 4,321 | 3,947 | 3,559 | 1,904 | 2,489 | 2,489 | 439 | 3,293 | 3,383 | 3,209 | 4,339 |
| 2014 | 4,987 | 2,740 | 3,068 | 1,537 | 1,959 | 1,661 | 1,656 | 640 | 2,777 | 2,822 | 5,555 | 7,451 |
| 2015 | 5,875 | 3,239 | 3,208 | 4,255 | 4,605 | 2,741 | 3,588 | 2,828 | 4,991 | 4,044 | 5,253 | 6,787 |
| 2016 | 5,500 | 4,216 | 4,024 | 2,984 | 4,186 | 4,495 | 4,438 | 5,393 | 2,438 | 3,916 | 2,204 | 3,052 |
| 2017 | 3,353 | 2,329 | 2,634 | 1,588 | 2,347 | 1,731 | 2,152 | 1,322 | 2,130 | 2,353 | 3,632 | 2,239 |
| 2018 | 1,798 | 1,711 | 592 | 2,025 | 1,231 | 1,638 | 1,888 | 1,662 | 2,952 | 3,157 | 1,570 | 1,983 |
| 2019 | 3,160 | 3,379 | 4,318 | 2,345 | 2,000 | 2,635 | 3,361 | 1,853 | 743 | 2,581 | 2,475 | 2,562 |
| 2020 | 2,370 | 1,811 | 1,998 | 2,239 | 728 | 1,661 | 1,680 | 1,678 | 1,446 | 1,795 | 1,483 | 1,858 |
| 2021 | 1,911 | 744 | 2,374 | 2,465 | 3,076 | 2,050 | 2,837 | 3,380 | 2,299 | 3,574 | 3,172 | 3,922 |
| 2022 | 2,651 | 1,542 | 2,320 | 2,158 | 1,251 | 3,945 | 2,109 | 2,038 | 2,403 | 1,473 | 1,891 | 4,011 |
| 2023 | 2,395 | 673 | 2,482 | 1,212 | 2,541 | 2,116 | 3,405 | 2,874 | 1,976 | 2,083 | 4,607 | 2,737 |
| 2024 | 3,720 | 1,178 | 1,472 | 2,121 | ||||||||
| - = No Data Reported; -- = Not Applicable; NA = Not Available; W = Withheld to avoid disclosure of individual company data. |
| Release Date: 6/28/2024 |
| Next Release Date: 7/31/2024 |