|
Download Data (XLS File) |
|
||||||||
|
||||||||
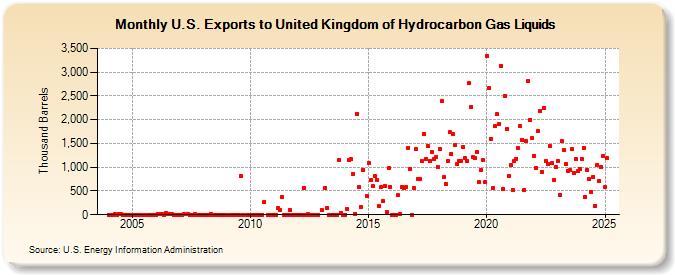
| U.S. Exports to United Kingdom of Hydrocarbon Gas Liquids (Thousand Barrels) | ||||||||
| Year | Jan | Feb | Mar | Apr | May | Jun | Jul | Aug | Sep | Oct | Nov | Dec |
|---|---|---|---|---|---|---|---|---|---|---|---|---|
| 2004 | 4 | 1 | 3 | 8 | 3 | 8 | 6 | 2 | 1 | 0 | 2 | 1 |
| 2005 | 2 | 0 | 1 | 2 | 3 | 3 | 2 | 2 | 4 | 4 | ||
| 2006 | 4 | 11 | 15 | 15 | 0 | 28 | 9 | 11 | 11 | 2 | 2 | 0 |
| 2007 | 2 | 0 | 11 | 10 | 1 | 0 | 3 | 10 | 4 | 2 | 0 | |
| 2008 | 3 | 3 | 4 | 1 | 17 | 0 | 0 | 0 | 0 | 0 | 0 | 0 |
| 2009 | 0 | 0 | 0 | 0 | 0 | 0 | 811 | 0 | 0 | 2 | ||
| 2010 | 1 | 2 | 3 | 2 | 1 | 2 | 3 | 278 | 2 | 1 | 2 | |
| 2011 | 2 | 1 | 145 | 104 | 376 | 1 | 1 | 2 | 100 | 1 | 2 | 0 |
| 2012 | 1 | 2 | 1 | 552 | 4 | 5 | 2 | 0 | 1 | 1 | ||
| 2013 | 94 | 564 | 146 | 4 | 1 | 0 | 1 | 1 | 1,151 | 41 | 1 | |
| 2014 | 1 | 124 | 1,148 | 1,166 | 867 | 15 | 2,125 | 579 | 163 | 944 | 386 | |
| 2015 | 1,089 | 720 | 603 | 808 | 740 | 181 | 577 | 287 | 606 | 56 | 973 | 591 |
| 2016 | 3 | 4 | 3 | 408 | 13 | 585 | 561 | 580 | 1,412 | 966 | 1 | 553 |
| 2017 | 1,387 | 755 | 754 | 1,129 | 1,698 | 1,163 | 1,453 | 1,127 | 1,322 | 1,176 | 1,204 | 996 |
| 2018 | 1,377 | 2,386 | 796 | 656 | 1,133 | 1,733 | 1,285 | 1,692 | 1,475 | 1,060 | 1,137 | 1,131 |
| 2019 | 1,417 | 1,187 | 1,133 | 2,768 | 2,266 | 1,209 | 1,190 | 1,328 | 679 | 946 | 1,154 | 682 |
| 2020 | 3,346 | 2,671 | 1,600 | 556 | 1,857 | 2,112 | 1,902 | 3,131 | 532 | 2,488 | 1,796 | 807 |
| 2021 | 1,050 | 526 | 1,126 | 1,182 | 1,394 | 1,866 | 1,567 | 510 | 1,544 | 2,816 | 2,001 | 1,609 |
| 2022 | 1,245 | 982 | 1,766 | 2,184 | 908 | 2,247 | 1,128 | 1,076 | 1,440 | 1,079 | 738 | 1,000 |
| 2023 | 1,120 | 413 | 1,817 | 1,408 | 1,071 | 920 | 934 | 1,380 | 1,028 | 1,171 | 910 | 957 |
| 2024 | 1,180 | 1,410 | 371 | 940 | ||||||||
| - = No Data Reported; -- = Not Applicable; NA = Not Available; W = Withheld to avoid disclosure of individual company data. |
| Release Date: 6/28/2024 |
| Next Release Date: 7/31/2024 |