|
Download Data (XLS File) |
|
||||||||
|
||||||||
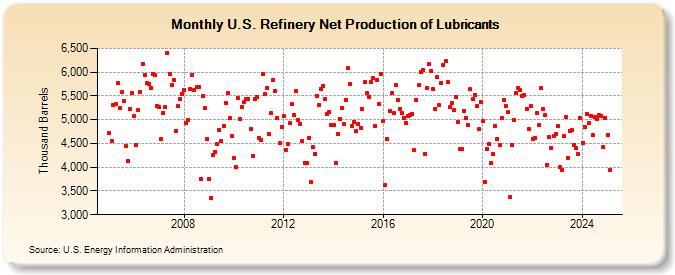
| U.S. Refinery Net Production of Lubricants (Thousand Barrels) | ||||||||
| Year | Jan | Feb | Mar | Apr | May | Jun | Jul | Aug | Sep | Oct | Nov | Dec |
|---|---|---|---|---|---|---|---|---|---|---|---|---|
| 2005 | 4,714 | 4,555 | 5,300 | 5,323 | 5,773 | 5,239 | 5,575 | 5,400 | 4,437 | 4,140 | 5,230 | 5,552 |
| 2006 | 5,069 | 4,474 | 5,195 | 5,584 | 6,172 | 5,941 | 5,763 | 5,745 | 5,669 | 5,962 | 5,935 | 5,290 |
| 2007 | 5,263 | 4,587 | 5,148 | 5,270 | 6,403 | 5,971 | 5,739 | 5,838 | 4,768 | 5,279 | 5,441 | 5,534 |
| 2008 | 5,624 | 4,929 | 4,996 | 5,640 | 5,935 | 5,626 | 5,689 | 5,684 | 3,758 | 5,503 | 5,244 | 4,584 |
| 2009 | 3,758 | 3,358 | 4,263 | 4,327 | 4,488 | 4,780 | 4,545 | 4,862 | 5,355 | 5,560 | 5,026 | 4,666 |
| 2010 | 4,188 | 4,011 | 5,448 | 5,020 | 5,277 | 5,381 | 5,440 | 5,441 | 4,800 | 4,233 | 5,438 | 5,476 |
| 2011 | 4,623 | 4,566 | 5,963 | 5,531 | 5,677 | 4,709 | 5,139 | 5,826 | 5,596 | 5,032 | 4,499 | 4,845 |
| 2012 | 5,070 | 4,365 | 4,481 | 4,922 | 5,328 | 5,095 | 5,605 | 4,985 | 4,915 | 4,559 | 4,094 | 4,097 |
| 2013 | 4,614 | 3,686 | 4,415 | 4,286 | 5,504 | 5,319 | 5,651 | 5,714 | 5,445 | 5,115 | 5,156 | 4,892 |
| 2014 | 4,894 | 4,096 | 4,704 | 5,013 | 5,241 | 4,905 | 5,409 | 6,077 | 5,749 | 4,868 | 4,952 | 4,770 |
| 2015 | 4,911 | 4,835 | 5,225 | 5,784 | 5,558 | 5,473 | 5,795 | 5,883 | 4,861 | 5,825 | 5,340 | 5,959 |
| 2016 | 4,980 | 3,621 | 4,597 | 5,190 | 5,554 | 5,138 | 5,725 | 5,417 | 5,231 | 5,132 | 5,039 | 4,930 |
| 2017 | 5,082 | 5,091 | 5,126 | 4,356 | 5,414 | 5,720 | 6,002 | 6,039 | 4,287 | 5,660 | 6,166 | 6,027 |
| 2018 | 5,638 | 5,231 | 5,901 | 5,300 | 5,772 | 6,150 | 6,227 | 5,795 | 5,260 | 5,353 | 5,195 | 5,478 |
| 2019 | 4,953 | 4,389 | 4,381 | 5,185 | 5,026 | 4,880 | 5,635 | 5,428 | 5,527 | 5,297 | 4,794 | 5,382 |
| 2020 | 4,978 | 3,688 | 4,378 | 4,486 | 4,093 | 4,283 | 4,870 | 4,593 | 4,469 | 5,039 | 5,421 | 5,296 |
| 2021 | 5,154 | 3,376 | 4,461 | 4,985 | 5,566 | 5,668 | 5,623 | 5,488 | 5,518 | 5,232 | 4,808 | 5,295 |
| 2022 | 4,601 | 4,622 | 5,134 | 4,890 | 5,656 | 5,217 | 5,101 | 4,047 | 4,636 | 4,414 | 4,652 | 4,700 |
| 2023 | 4,876 | 3,996 | 3,941 | 4,647 | 5,058 | 4,194 | 4,770 | 4,779 | 4,471 | 4,403 | 4,288 | 5,034 |
| 2024 | 4,503 | 4,854 | 5,124 | 4,932 | 5,077 | 4,677 | 5,046 | 5,016 | 5,108 | 5,078 | 4,419 | 5,045 |
| 2025 | 4,669 | 3,940 | 4,850 | 3,900 | ||||||||
| - = No Data Reported; -- = Not Applicable; NA = Not Available; W = Withheld to avoid disclosure of individual company data. |
| Release Date: 6/30/2025 |
| Next Release Date: 7/31/2025 |
Referring Pages: