|
Download Data (XLS File) |
|
||||||||
|
||||||||
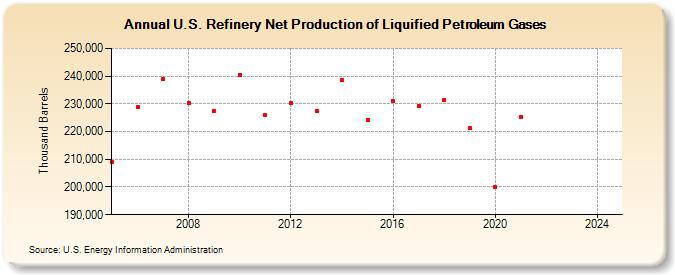
| U.S. Refinery Net Production of Liquified Petroleum Gases (Thousand Barrels) | ||||||||
| Decade | Year-0 | Year-1 | Year-2 | Year-3 | Year-4 | Year-5 | Year-6 | Year-7 | Year-8 | Year-9 |
|---|---|---|---|---|---|---|---|---|---|---|
| 2000's | 209,029 | 228,960 | 238,904 | 230,431 | 227,470 | |||||
| 2010's | 240,454 | 225,992 | 230,413 | 227,349 | 238,485 | 224,329 | 231,136 | 229,391 | 231,535 | 221,122 |
| 2020's | 199,822 | 225,205 | -- | -- |
| - = No Data Reported; -- = Not Applicable; NA = Not Available; W = Withheld to avoid disclosure of individual company data. |
| Release Date: 6/28/2024 |
| Next Release Date: 8/30/2024 |