|
Download Data (XLS File) |
|
||||||||
|
||||||||
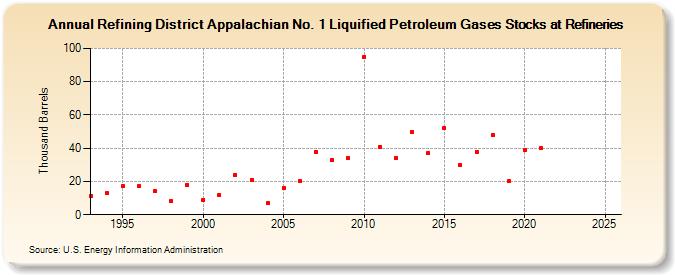
| Refining District Appalachian No. 1 Liquified Petroleum Gases Stocks at Refineries (Thousand Barrels) | ||||||||
| Decade | Year-0 | Year-1 | Year-2 | Year-3 | Year-4 | Year-5 | Year-6 | Year-7 | Year-8 | Year-9 |
|---|---|---|---|---|---|---|---|---|---|---|
| 1990's | 11 | 13 | 17 | 17 | 14 | 8 | 18 | |||
| 2000's | 9 | 12 | 24 | 21 | 7 | 16 | 20 | 38 | 33 | 34 |
| 2010's | 95 | 41 | 34 | 50 | 37 | 52 | 30 | 38 | 48 | 20 |
| 2020's | 39 | 40 | -- | -- |
| - = No Data Reported; -- = Not Applicable; NA = Not Available; W = Withheld to avoid disclosure of individual company data. |
| Release Date: 8/30/2024 |
| Next Release Date: 8/29/2025 |