|
Download Data (XLS File) |
|
||||||||
|
||||||||
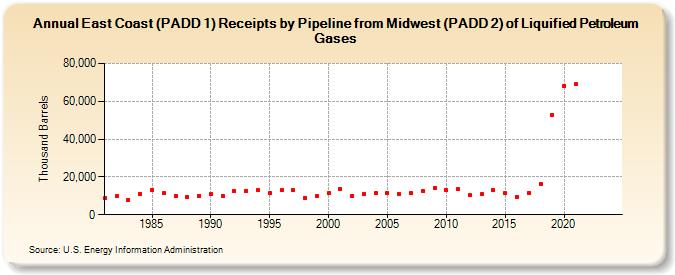
| East Coast (PADD 1) Receipts by Pipeline from Midwest (PADD 2) of Liquified Petroleum Gases (Thousand Barrels) | ||||||||
| Decade | Year-0 | Year-1 | Year-2 | Year-3 | Year-4 | Year-5 | Year-6 | Year-7 | Year-8 | Year-9 |
|---|---|---|---|---|---|---|---|---|---|---|
| 1980's | 8,732 | 9,749 | 7,843 | 11,201 | 13,265 | 11,342 | 9,851 | 9,360 | 10,079 | |
| 1990's | 10,835 | 9,975 | 12,474 | 12,755 | 12,815 | 11,588 | 13,163 | 12,847 | 9,088 | 10,162 |
| 2000's | 11,357 | 13,720 | 10,031 | 10,909 | 11,228 | 11,522 | 11,076 | 11,293 | 12,517 | 14,012 |
| 2010's | 12,826 | 13,367 | 10,283 | 10,886 | 12,884 | 11,391 | 9,357 | 11,671 | 16,320 | 52,984 |
| 2020's | 68,042 | 68,997 | -- | -- | -- |
| - = No Data Reported; -- = Not Applicable; NA = Not Available; W = Withheld to avoid disclosure of individual company data. |
| Release Date: 6/30/2025 |
| Next Release Date: 8/29/2025 |