|
Download Data (XLS File) |
|
||||||||
|
||||||||
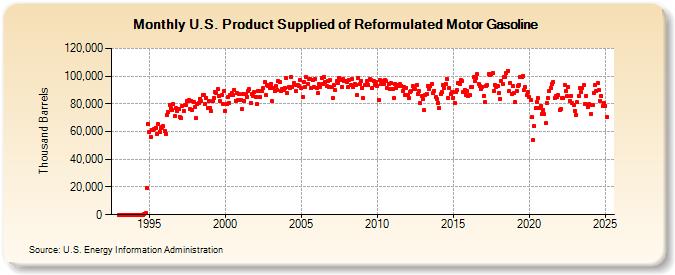
| U.S. Product Supplied of Reformulated Motor Gasoline (Thousand Barrels) | ||||||||
| Year | Jan | Feb | Mar | Apr | May | Jun | Jul | Aug | Sep | Oct | Nov | Dec |
|---|---|---|---|---|---|---|---|---|---|---|---|---|
| 1993 | 0 | 0 | 0 | 0 | 0 | 0 | 0 | 0 | 0 | 0 | 0 | 0 |
| 1994 | 0 | 0 | 0 | 0 | 0 | 0 | 0 | 0 | 273 | 1,000 | 19,610 | 65,602 |
| 1995 | 59,788 | 55,976 | 61,253 | 60,854 | 61,865 | 62,781 | 58,303 | 65,308 | 59,773 | 62,675 | 63,020 | 63,723 |
| 1996 | 60,711 | 58,415 | 71,941 | 73,796 | 79,410 | 76,766 | 75,263 | 79,818 | 70,913 | 76,740 | 74,795 | 76,066 |
| 1997 | 70,774 | 69,715 | 78,422 | 75,105 | 78,829 | 78,967 | 82,096 | 82,628 | 75,918 | 82,354 | 75,819 | 81,035 |
| 1998 | 78,070 | 69,522 | 79,834 | 80,260 | 83,628 | 81,749 | 86,595 | 86,274 | 79,865 | 84,530 | 76,753 | 82,216 |
| 1999 | 77,144 | 74,618 | 81,731 | 84,223 | 88,815 | 87,773 | 90,505 | 85,700 | 81,719 | 86,304 | 80,201 | 89,365 |
| 2000 | 74,899 | 79,690 | 84,998 | 80,953 | 86,529 | 88,009 | 86,157 | 90,178 | 82,247 | 87,584 | 82,707 | 86,908 |
| 2001 | 83,087 | 76,061 | 86,952 | 81,972 | 87,454 | 84,938 | 89,094 | 90,478 | 80,837 | 86,912 | 85,825 | 88,571 |
| 2002 | 85,286 | 79,920 | 88,967 | 84,980 | 88,962 | 89,052 | 91,234 | 95,391 | 86,064 | 93,455 | 92,833 | 91,727 |
| 2003 | 94,665 | 81,877 | 91,218 | 89,158 | 92,551 | 90,184 | 96,428 | 95,621 | 89,209 | 90,588 | 90,103 | 91,642 |
| 2004 | 98,609 | 87,503 | 92,290 | 91,121 | 99,423 | 92,195 | 95,156 | 93,779 | 89,141 | 93,640 | 92,847 | 97,438 |
| 2005 | 91,667 | 85,066 | 95,924 | 92,156 | 99,086 | 94,349 | 98,194 | 97,901 | 91,072 | 97,425 | 92,256 | 97,907 |
| 2006 | 91,515 | 87,612 | 94,091 | 92,312 | 98,721 | 94,516 | 99,405 | 95,620 | 92,681 | 96,826 | 92,257 | 96,963 |
| 2007 | 91,976 | 84,108 | 93,332 | 89,761 | 96,404 | 94,701 | 98,300 | 97,243 | 92,263 | 98,051 | 96,331 | 96,257 |
| 2008 | 95,548 | 91,956 | 97,296 | 93,725 | 97,863 | 91,891 | 94,425 | 93,847 | 86,659 | 98,990 | 94,241 | 96,534 |
| 2009 | 91,772 | 83,857 | 93,469 | 93,901 | 96,304 | 93,776 | 97,588 | 97,379 | 91,149 | 96,130 | 93,477 | 95,533 |
| 2010 | 92,879 | 82,853 | 97,047 | 93,948 | 96,460 | 94,613 | 97,303 | 96,259 | 91,420 | 94,073 | 91,060 | 94,767 |
| 2011 | 90,452 | 83,915 | 94,423 | 91,717 | 93,700 | 92,530 | 94,134 | 92,878 | 89,439 | 92,133 | 86,461 | 91,440 |
| 2012 | 86,247 | 84,039 | 88,671 | 89,534 | 93,008 | 90,762 | 90,384 | 93,751 | 87,451 | 89,071 | 80,478 | 85,712 |
| 2013 | 83,334 | 75,231 | 86,689 | 87,151 | 93,092 | 90,580 | 93,010 | 94,476 | 87,562 | 89,611 | 85,069 | 83,675 |
| 2014 | 80,925 | 76,918 | 86,897 | 88,238 | 93,903 | 91,727 | 94,418 | 97,556 | 84,374 | 91,416 | 86,785 | 88,833 |
| 2015 | 84,277 | 80,646 | 88,572 | 89,655 | 95,114 | 94,165 | 97,242 | 96,582 | 88,248 | 90,178 | 86,435 | 89,043 |
| 2016 | 85,346 | 86,294 | 92,065 | 92,439 | 99,351 | 96,305 | 98,688 | 101,189 | 94,327 | 92,663 | 91,049 | 92,360 |
| 2017 | 85,952 | 81,057 | 93,084 | 93,621 | 101,688 | 100,832 | 101,641 | 102,391 | 89,204 | 93,612 | 91,953 | 92,734 |
| 2018 | 88,121 | 83,774 | 96,792 | 94,538 | 99,205 | 99,598 | 102,006 | 104,044 | 89,040 | 95,061 | 87,166 | 92,845 |
| 2019 | 87,465 | 81,024 | 89,309 | 93,155 | 93,810 | 99,084 | 99,414 | 100,271 | 90,003 | 91,906 | 86,034 | 88,462 |
| 2020 | 85,106 | 82,957 | 70,358 | 54,011 | 63,819 | 76,938 | 81,516 | 84,065 | 76,797 | 78,594 | 72,899 | 75,794 |
| 2021 | 72,630 | 65,876 | 80,366 | 83,959 | 89,058 | 91,368 | 94,379 | 95,841 | 84,382 | 85,582 | 84,719 | 86,127 |
| 2022 | 75,299 | 76,297 | 84,390 | 83,909 | 93,508 | 89,070 | 85,566 | 91,930 | 82,152 | 85,957 | 80,390 | 79,308 |
| 2023 | 73,728 | 72,172 | 81,656 | 86,120 | 91,185 | 88,238 | 90,858 | 94,103 | 79,899 | 85,884 | 76,758 | 79,598 |
| 2024 | 79,285 | 72,666 | 79,089 | 87,746 | ||||||||
| - = No Data Reported; -- = Not Applicable; NA = Not Available; W = Withheld to avoid disclosure of individual company data. |
| Release Date: 6/28/2024 |
| Next Release Date: 7/31/2024 |