|
Download Data (XLS File) |
|
||||||||
|
||||||||
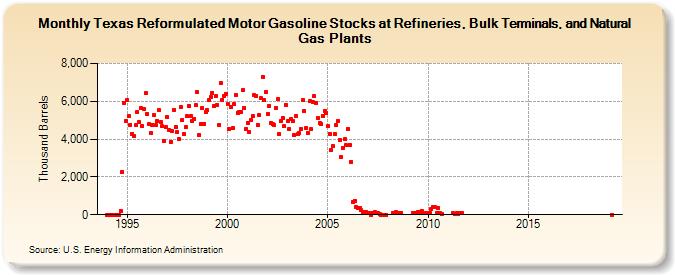
| Texas Reformulated Motor Gasoline Stocks at Refineries, Bulk Terminals, and Natural Gas Plants (Thousand Barrels) | ||||||||
| Year | Jan | Feb | Mar | Apr | May | Jun | Jul | Aug | Sep | Oct | Nov | Dec |
|---|---|---|---|---|---|---|---|---|---|---|---|---|
| 1994 | 0 | 0 | 0 | 0 | 0 | 0 | 0 | 0 | 202 | 2,273 | 5,935 | 4,965 |
| 1995 | 6,065 | 5,212 | 4,770 | 4,287 | 4,171 | 4,740 | 5,418 | 4,898 | 5,655 | 4,682 | 5,612 | 6,413 |
| 1996 | 5,336 | 4,773 | 4,309 | 4,763 | 5,276 | 4,738 | 4,945 | 5,528 | 4,892 | 4,678 | 3,899 | 4,620 |
| 1997 | 5,153 | 4,491 | 3,861 | 4,411 | 5,554 | 4,650 | 4,362 | 4,016 | 5,709 | 5,016 | 4,260 | 4,627 |
| 1998 | 5,199 | 5,774 | 5,208 | 4,936 | 5,084 | 5,788 | 6,476 | 4,224 | 4,810 | 5,631 | 4,805 | 5,453 |
| 1999 | 5,524 | 6,057 | 6,207 | 6,434 | 5,761 | 6,278 | 5,804 | 4,746 | 6,975 | 6,073 | 6,298 | 6,403 |
| 2000 | 5,871 | 4,535 | 5,690 | 4,578 | 5,841 | 6,337 | 5,405 | 5,432 | 5,435 | 6,582 | 5,653 | 4,544 |
| 2001 | 4,878 | 4,359 | 4,987 | 5,196 | 6,315 | 6,303 | 4,742 | 5,263 | 6,160 | 7,292 | 6,067 | 6,498 |
| 2002 | 5,320 | 5,752 | 4,853 | 4,790 | 4,765 | 5,659 | 6,101 | 4,268 | 4,955 | 5,128 | 4,672 | 5,829 |
| 2003 | 4,943 | 4,522 | 5,047 | 4,938 | 4,212 | 5,222 | 4,245 | 4,312 | 4,515 | 6,081 | 5,486 | 4,586 |
| 2004 | 4,343 | 5,995 | 4,510 | 5,940 | 6,258 | 5,884 | 5,142 | 4,871 | 4,802 | 5,248 | 5,504 | 5,406 |
| 2005 | 4,676 | 4,287 | 3,423 | 3,622 | 4,283 | 4,736 | 4,966 | 3,961 | 3,038 | 3,536 | 3,990 | 3,665 |
| 2006 | 4,557 | 3,711 | 2,791 | 685 | 743 | 432 | 368 | 365 | 248 | 141 | 170 | 146 |
| 2007 | 100 | 110 | 10 | 104 | 128 | 84 | 81 | 36 | 7 | 6 | 2 | 4 |
| 2008 | 79 | 76 | 126 | 108 | 108 | 110 | ||||||
| 2009 | 79 | 115 | 83 | 161 | 135 | 215 | 83 | 113 | 100 | |||
| 2010 | 100 | 100 | 304 | 422 | 389 | 90 | 354 | 97 | 23 | |||
| 2011 | 70 | 30 | 75 | 55 | 103 | 66 | ||||||
| 2012 | 55 | 82 | 89 | 113 | 95 | 25 | ||||||
| 2019 | 0 | |||||||||||
| - = No Data Reported; -- = Not Applicable; NA = Not Available; W = Withheld to avoid disclosure of individual company data. |
| Release Date: 6/28/2024 |
| Next Release Date: 7/31/2024 |