|
Download Data (XLS File) |
|
||||||||
|
||||||||
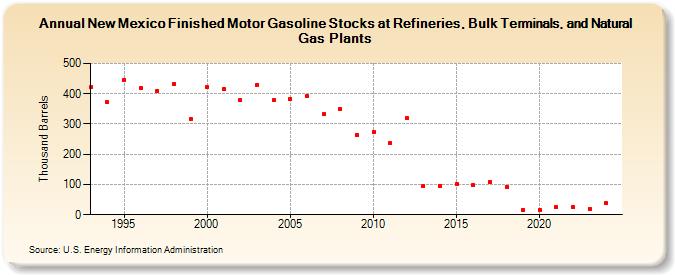
| New Mexico Finished Motor Gasoline Stocks at Refineries, Bulk Terminals, and Natural Gas Plants (Thousand Barrels) | ||||||||
| Decade | Year-0 | Year-1 | Year-2 | Year-3 | Year-4 | Year-5 | Year-6 | Year-7 | Year-8 | Year-9 |
|---|---|---|---|---|---|---|---|---|---|---|
| 1990's | 421 | 371 | 446 | 418 | 410 | 433 | 317 | |||
| 2000's | 422 | 415 | 378 | 429 | 378 | 384 | 391 | 332 | 350 | 264 |
| 2010's | 273 | 237 | 319 | 94 | 96 | 102 | 98 | 108 | 93 | 15 |
| 2020's | 16 | 24 | 24 | 20 | 38 |
| - = No Data Reported; -- = Not Applicable; NA = Not Available; W = Withheld to avoid disclosure of individual company data. |
| Release Date: 6/30/2025 |
| Next Release Date: 8/29/2025 |