|
Download Data (XLS File) |
|
||||||||
|
||||||||
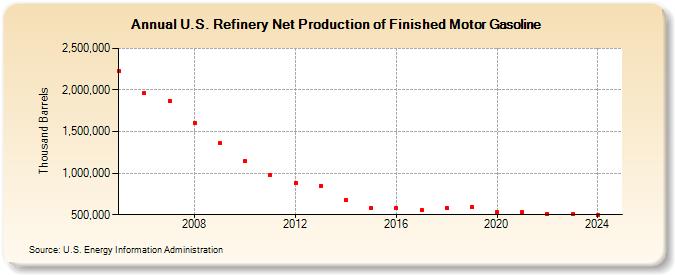
| U.S. Refinery Net Production of Finished Motor Gasoline (Thousand Barrels) | ||||||||
| Decade | Year-0 | Year-1 | Year-2 | Year-3 | Year-4 | Year-5 | Year-6 | Year-7 | Year-8 | Year-9 |
|---|---|---|---|---|---|---|---|---|---|---|
| 2000's | 2,225,344 | 1,965,341 | 1,866,179 | 1,606,480 | 1,358,559 | |||||
| 2010's | 1,142,191 | 981,289 | 875,709 | 845,935 | 681,237 | 586,056 | 580,327 | 557,912 | 585,669 | 590,438 |
| 2020's | 527,495 | 527,272 | 509,164 | 506,435 |
| - = No Data Reported; -- = Not Applicable; NA = Not Available; W = Withheld to avoid disclosure of individual company data. |
| Release Date: 6/28/2024 |
| Next Release Date: 8/30/2024 |