|
Download Data (XLS File) |
|
||||||||
|
||||||||
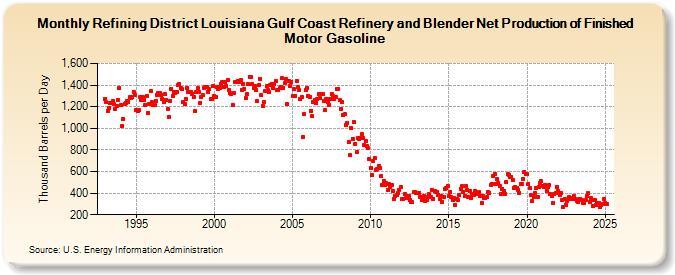
| Refining District Louisiana Gulf Coast Refinery and Blender Net Production of Finished Motor Gasoline (Thousand Barrels per Day) | ||||||||
| Year | Jan | Feb | Mar | Apr | May | Jun | Jul | Aug | Sep | Oct | Nov | Dec |
|---|---|---|---|---|---|---|---|---|---|---|---|---|
| 1993 | 1,272 | 1,241 | 1,164 | 1,186 | 1,233 | 1,233 | 1,252 | 1,221 | 1,180 | 1,210 | 1,262 | 1,373 |
| 1994 | 1,217 | 1,023 | 1,084 | 1,228 | 1,237 | 1,254 | 1,247 | 1,286 | 1,283 | 1,286 | 1,336 | 1,304 |
| 1995 | 1,171 | 1,156 | 1,165 | 1,287 | 1,260 | 1,286 | 1,266 | 1,219 | 1,295 | 1,144 | 1,228 | 1,341 |
| 1996 | 1,239 | 1,213 | 1,212 | 1,254 | 1,309 | 1,329 | 1,329 | 1,305 | 1,274 | 1,243 | 1,315 | 1,265 |
| 1997 | 1,177 | 1,104 | 1,254 | 1,363 | 1,295 | 1,338 | 1,327 | 1,337 | 1,402 | 1,408 | 1,375 | 1,360 |
| 1998 | 1,241 | 1,224 | 1,270 | 1,375 | 1,339 | 1,339 | 1,336 | 1,321 | 1,292 | 1,157 | 1,335 | 1,370 |
| 1999 | 1,337 | 1,232 | 1,294 | 1,304 | 1,370 | 1,386 | 1,378 | 1,338 | 1,362 | 1,274 | 1,269 | 1,387 |
| 2000 | 1,297 | 1,286 | 1,384 | 1,364 | 1,377 | 1,414 | 1,427 | 1,385 | 1,429 | 1,393 | 1,446 | 1,354 |
| 2001 | 1,326 | 1,316 | 1,218 | 1,329 | 1,430 | 1,425 | 1,437 | 1,432 | 1,445 | 1,357 | 1,413 | 1,364 |
| 2002 | 1,278 | 1,314 | 1,407 | 1,477 | 1,475 | 1,406 | 1,370 | 1,395 | 1,350 | 1,249 | 1,398 | 1,459 |
| 2003 | 1,305 | 1,211 | 1,243 | 1,345 | 1,389 | 1,357 | 1,332 | 1,398 | 1,413 | 1,374 | 1,410 | 1,440 |
| 2004 | 1,351 | 1,351 | 1,370 | 1,384 | 1,461 | 1,376 | 1,419 | 1,456 | 1,222 | 1,442 | 1,393 | 1,433 |
| 2005 | 1,303 | 1,361 | 1,302 | 1,438 | 1,379 | 1,357 | 1,271 | 1,290 | 920 | 1,136 | 1,359 | 1,372 |
| 2006 | 1,300 | 1,294 | 1,162 | 1,110 | 1,239 | 1,259 | 1,237 | 1,270 | 1,316 | 1,280 | 1,313 | 1,317 |
| 2007 | 1,257 | 1,168 | 1,273 | 1,245 | 1,220 | 1,268 | 1,322 | 1,295 | 1,267 | 1,288 | 1,367 | 1,368 |
| 2008 | 1,259 | 1,178 | 1,244 | 1,124 | 1,128 | 1,030 | 1,045 | 875 | 752 | 1,003 | 905 | 1,057 |
| 2009 | 859 | 777 | 910 | 905 | 910 | 943 | 912 | 846 | 883 | 833 | 814 | 716 |
| 2010 | 637 | 568 | 701 | 727 | 616 | 621 | 650 | 637 | 560 | 475 | 508 | 475 |
| 2011 | 491 | 431 | 481 | 454 | 474 | 415 | 346 | 376 | 382 | 403 | 432 | 454 |
| 2012 | 350 | 343 | 395 | 354 | 362 | 377 | 334 | 318 | 314 | 406 | 406 | 404 |
| 2013 | 402 | 404 | 364 | 336 | 368 | 373 | 328 | 334 | 363 | 391 | 365 | 432 |
| 2014 | 350 | 420 | 411 | 411 | 386 | 342 | 376 | 319 | 368 | 441 | 449 | 467 |
| 2015 | 369 | 408 | 365 | 338 | 357 | 293 | 348 | 339 | 383 | 441 | 463 | 408 |
| 2016 | 375 | 462 | 432 | 368 | 419 | 359 | 388 | 383 | 422 | 404 | 389 | 406 |
| 2017 | 376 | 312 | 375 | 353 | 354 | 361 | 413 | 404 | 477 | 488 | 559 | 581 |
| 2018 | 487 | 526 | 493 | 464 | 396 | 442 | 424 | 395 | 501 | 574 | 569 | 545 |
| 2019 | 550 | 517 | 449 | 457 | 448 | 432 | 404 | 488 | 484 | 535 | 600 | 574 |
| 2020 | 577 | 488 | 444 | 382 | 327 | 362 | 400 | 451 | 363 | 459 | 491 | 508 |
| 2021 | 463 | 461 | 471 | 424 | 452 | 477 | 392 | 369 | 306 | 393 | 399 | 459 |
| 2022 | 418 | 382 | 403 | 333 | 275 | 341 | 291 | 328 | 360 | 341 | 342 | 356 |
| 2023 | 373 | 344 | 330 | 320 | 341 | 344 | 337 | 305 | 305 | 336 | 373 | 399 |
| 2024 | 316 | 351 | 333 | 281 | 333 | 293 | ||||||
| - = No Data Reported; -- = Not Applicable; NA = Not Available; W = Withheld to avoid disclosure of individual company data. |
| Release Date: 8/30/2024 |
| Next Release Date: 9/30/2024 |