|
Download Data (XLS File) |
|
||||||||
|
||||||||
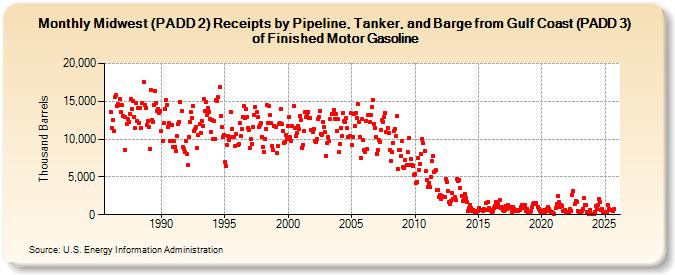
| Midwest (PADD 2) Receipts by Pipeline, Tanker, and Barge from Gulf Coast (PADD 3) of Finished Motor Gasoline (Thousand Barrels) | ||||||||
| Year | Jan | Feb | Mar | Apr | May | Jun | Jul | Aug | Sep | Oct | Nov | Dec |
|---|---|---|---|---|---|---|---|---|---|---|---|---|
| 1986 | 13,610 | 11,531 | 12,578 | 11,051 | 15,621 | 15,816 | 14,334 | 14,636 | 14,487 | 15,288 | 13,548 | 14,466 |
| 1987 | 12,997 | 8,604 | 12,873 | 11,932 | 12,595 | 12,227 | 13,328 | 15,316 | 13,942 | 15,001 | 12,981 | 11,415 |
| 1988 | 14,724 | 12,407 | 14,141 | 12,174 | 14,177 | 11,510 | 14,795 | 17,607 | 14,513 | 14,149 | 11,870 | 12,375 |
| 1989 | 11,638 | 8,743 | 16,514 | 12,573 | 12,280 | 14,567 | 16,406 | 14,835 | 13,669 | 13,988 | 13,406 | 13,778 |
| 1990 | 11,020 | 9,750 | 12,075 | 13,978 | 15,205 | 14,537 | 11,609 | 12,165 | 9,786 | 9,721 | 11,900 | 8,889 |
| 1991 | 9,718 | 8,980 | 8,367 | 10,367 | 11,949 | 12,207 | 14,915 | 13,682 | 8,921 | 8,655 | 8,350 | 9,789 |
| 1992 | 8,008 | 6,526 | 10,271 | 12,280 | 13,531 | 12,853 | 14,430 | 11,085 | 11,344 | 11,594 | 8,847 | 10,512 |
| 1993 | 11,947 | 10,753 | 12,410 | 11,754 | 15,271 | 13,658 | 14,842 | 13,160 | 14,053 | 13,565 | 12,657 | 10,884 |
| 1994 | 12,529 | 10,075 | 12,362 | 10,035 | 15,164 | 15,069 | 15,554 | 16,909 | 13,039 | 11,571 | 10,264 | 10,578 |
| 1995 | 6,939 | 6,398 | 9,256 | 10,459 | 9,910 | 10,227 | 13,587 | 11,396 | 10,316 | 10,266 | 9,080 | 10,738 |
| 1996 | 9,172 | 9,288 | 12,149 | 10,394 | 11,284 | 12,975 | 14,400 | 12,731 | 13,931 | 12,889 | 11,438 | 11,212 |
| 1997 | 8,845 | 9,959 | 9,366 | 11,576 | 13,182 | 14,204 | 13,540 | 12,885 | 11,581 | 11,893 | 12,083 | 10,247 |
| 1998 | 8,943 | 8,338 | 9,965 | 11,389 | 14,495 | 12,173 | 14,375 | 13,173 | 12,074 | 9,139 | 8,493 | 11,772 |
| 1999 | 11,620 | 8,178 | 9,093 | 11,994 | 12,174 | 14,008 | 11,967 | 11,044 | 9,464 | 9,649 | 10,605 | 9,981 |
| 2000 | 11,769 | 12,972 | 10,214 | 9,793 | 11,759 | 14,377 | 11,494 | 10,423 | 10,828 | 11,775 | 11,300 | 13,113 |
| 2001 | 12,563 | 8,870 | 9,238 | 11,008 | 13,551 | 12,914 | 13,202 | 13,580 | 12,787 | 12,727 | 11,164 | 10,989 |
| 2002 | 11,271 | 9,733 | 9,679 | 9,984 | 12,641 | 12,913 | 13,691 | 10,635 | 10,608 | 12,300 | 11,601 | 10,883 |
| 2003 | 7,745 | 9,526 | 10,250 | 9,750 | 12,639 | 13,354 | 13,328 | 13,867 | 12,715 | 13,350 | 11,114 | 12,640 |
| 2004 | 8,346 | 9,312 | 11,531 | 10,418 | 13,419 | 12,387 | 12,281 | 12,799 | 11,460 | 10,327 | 10,375 | 13,403 |
| 2005 | 9,263 | 10,292 | 13,274 | 11,786 | 13,480 | 12,829 | 14,630 | 12,229 | 10,256 | 7,524 | 12,617 | 9,921 |
| 2006 | 8,573 | 8,261 | 12,448 | 8,687 | 13,163 | 12,231 | 13,239 | 14,233 | 15,236 | 11,940 | 11,450 | 10,281 |
| 2007 | 8,089 | 8,585 | 9,834 | 9,646 | 11,206 | 12,546 | 12,274 | 12,915 | 13,477 | 10,933 | 11,514 | 10,836 |
| 2008 | 8,595 | 7,097 | 8,338 | 9,513 | 11,122 | 11,311 | 10,372 | 13,062 | 6,087 | 8,601 | 8,593 | 7,747 |
| 2009 | 9,740 | 6,357 | 6,139 | 7,301 | 6,607 | 8,280 | 10,140 | 6,640 | 7,432 | 6,600 | 6,433 | 5,302 |
| 2010 | 5,411 | 4,134 | 4,362 | 7,452 | 5,976 | 6,740 | 8,023 | 10,030 | 9,469 | 8,370 | 5,752 | 4,639 |
| 2011 | 3,686 | 4,189 | 3,635 | 5,029 | 7,041 | 7,766 | 5,612 | 5,775 | 5,882 | 3,211 | 3,326 | 2,356 |
| 2012 | 2,617 | 2,109 | 2,412 | 2,369 | 2,282 | 4,704 | 4,379 | 3,148 | 1,639 | 1,439 | 1,848 | 2,930 |
| 2013 | 2,135 | 2,110 | 2,347 | 1,935 | 4,750 | 4,485 | 4,624 | 3,551 | 2,536 | 1,794 | 1,996 | 2,777 |
| 2014 | 2,180 | 1,641 | 505 | 891 | 1,296 | 931 | 467 | 619 | 449 | 254 | 347 | 471 |
| 2015 | 502 | 911 | 679 | 619 | 464 | 737 | 640 | 1,487 | 686 | 1,647 | 926 | 643 |
| 2016 | 463 | 387 | 501 | 846 | 1,112 | 1,696 | 1,032 | 1,405 | 1,891 | 926 | 1,000 | 638 |
| 2017 | 548 | 560 | 1,182 | 762 | 1,297 | 892 | 897 | 1,037 | 387 | 989 | 780 | 504 |
| 2018 | 445 | 473 | 611 | 570 | 986 | 1,334 | 1,323 | 883 | 1,301 | 509 | 789 | 235 |
| 2019 | 217 | 309 | 532 | 975 | 1,466 | 1,545 | 1,389 | 1,570 | 971 | 813 | 529 | 401 |
| 2020 | 432 | 533 | 631 | 377 | 511 | 725 | 991 | 790 | 508 | 300 | 317 | 208 |
| 2021 | 140 | 834 | 1,355 | 2,459 | 1,666 | 966 | 1,230 | 1,199 | 439 | 518 | 641 | 248 |
| 2022 | 358 | 227 | 185 | 716 | 519 | 2,615 | 3,148 | 1,393 | 1,800 | 1,705 | 466 | 187 |
| 2023 | 377 | 401 | 538 | 809 | 2,268 | 1,295 | 1,281 | 420 | 242 | 156 | 664 | 143 |
| 2024 | 55 | |||||||||||
| - = No Data Reported; -- = Not Applicable; NA = Not Available; W = Withheld to avoid disclosure of individual company data. |
| Release Date: 3/29/2024 |
| Next Release Date: 4/30/2024 |