|
Download Data (XLS File) |
|
||||||||
|
||||||||
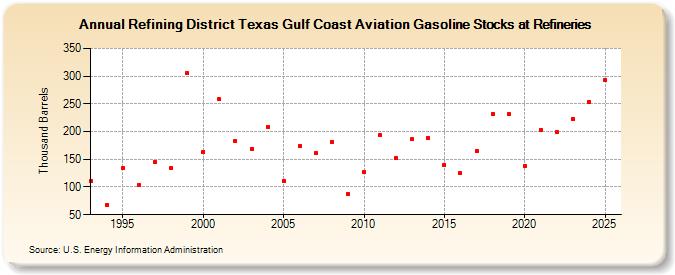
| Refining District Texas Gulf Coast Aviation Gasoline Stocks at Refineries (Thousand Barrels) | ||||||||
| Decade | Year-0 | Year-1 | Year-2 | Year-3 | Year-4 | Year-5 | Year-6 | Year-7 | Year-8 | Year-9 |
|---|---|---|---|---|---|---|---|---|---|---|
| 1990's | 110 | 68 | 134 | 104 | 145 | 134 | 305 | |||
| 2000's | 164 | 258 | 183 | 169 | 209 | 111 | 174 | 161 | 182 | 88 |
| 2010's | 127 | 193 | 152 | 186 | 189 | 140 | 125 | 165 | 232 | 231 |
| 2020's | 138 | 203 | 199 | 223 |
| - = No Data Reported; -- = Not Applicable; NA = Not Available; W = Withheld to avoid disclosure of individual company data. |
| Release Date: 3/29/2024 |
| Next Release Date: 8/30/2024 |