|
Download Data (XLS File) |
|
||||||||
|
||||||||
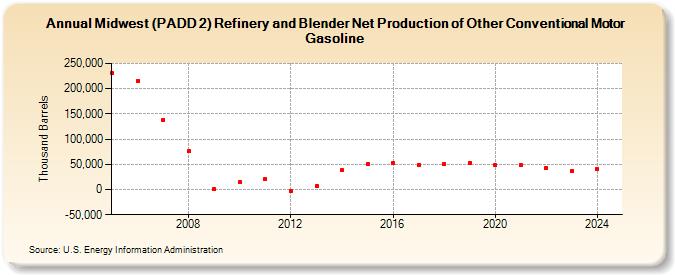
| Midwest (PADD 2) Refinery and Blender Net Production of Other Conventional Motor Gasoline (Thousand Barrels) | ||||||||
| Decade | Year-0 | Year-1 | Year-2 | Year-3 | Year-4 | Year-5 | Year-6 | Year-7 | Year-8 | Year-9 |
|---|---|---|---|---|---|---|---|---|---|---|
| 2000's | 230,880 | 216,052 | 138,176 | 75,772 | 112 | |||||
| 2010's | 14,290 | 20,547 | -2,672 | 6,936 | 38,683 | 49,911 | 52,318 | 48,665 | 50,521 | 53,529 |
| 2020's | 47,987 | 48,431 | 43,150 | 37,215 |
| - = No Data Reported; -- = Not Applicable; NA = Not Available; W = Withheld to avoid disclosure of individual company data. |
| Release Date: 3/29/2024 |
| Next Release Date: 8/30/2024 |