|
Download Data (XLS File) |
|
||||||||
|
||||||||
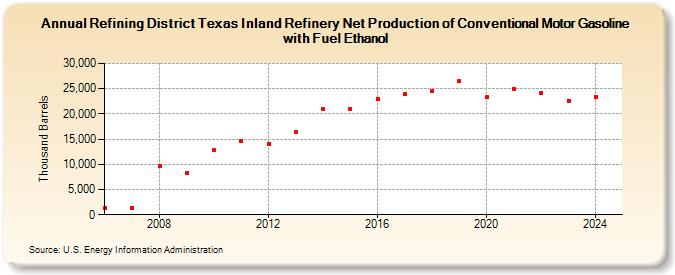
| Refining District Texas Inland Refinery Net Production of Conventional Motor Gasoline with Fuel Ethanol (Thousand Barrels) | ||||||||
| Decade | Year-0 | Year-1 | Year-2 | Year-3 | Year-4 | Year-5 | Year-6 | Year-7 | Year-8 | Year-9 |
|---|---|---|---|---|---|---|---|---|---|---|
| 2000's | 1,377 | 1,384 | 9,581 | 8,268 | ||||||
| 2010's | 12,773 | 14,536 | 14,116 | 16,491 | 20,911 | 21,054 | 22,966 | 24,026 | 24,551 | 26,479 |
| 2020's | 23,369 | 25,028 | 24,089 | 22,632 |
| - = No Data Reported; -- = Not Applicable; NA = Not Available; W = Withheld to avoid disclosure of individual company data. |
| Release Date: 6/28/2024 |
| Next Release Date: 8/30/2024 |