|
Download Data (XLS File) |
|
||||||||
|
||||||||
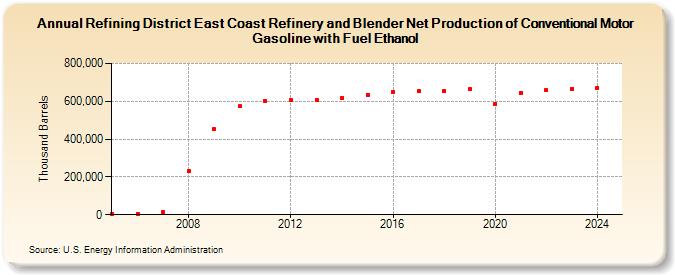
| Refining District East Coast Refinery and Blender Net Production of Conventional Motor Gasoline with Fuel Ethanol (Thousand Barrels) | ||||||||
| Decade | Year-0 | Year-1 | Year-2 | Year-3 | Year-4 | Year-5 | Year-6 | Year-7 | Year-8 | Year-9 |
|---|---|---|---|---|---|---|---|---|---|---|
| 2000's | 4,868 | 5,654 | 11,720 | 231,915 | 450,852 | |||||
| 2010's | 572,627 | 599,596 | 604,613 | 609,090 | 619,244 | 635,398 | 650,199 | 654,031 | 655,562 | 663,499 |
| 2020's | 587,103 | 645,588 | 657,395 | 666,440 | 671,800 |
| - = No Data Reported; -- = Not Applicable; NA = Not Available; W = Withheld to avoid disclosure of individual company data. |
| Release Date: 6/30/2025 |
| Next Release Date: 8/29/2025 |