|
Download Data (XLS File) |
|
||||||||
|
||||||||
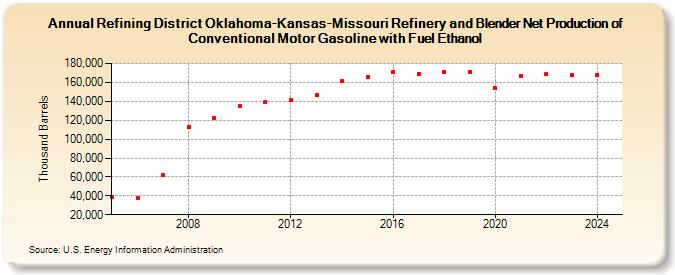
| Refining District Oklahoma-Kansas-Missouri Refinery and Blender Net Production of Conventional Motor Gasoline with Fuel Ethanol (Thousand Barrels) | ||||||||
| Decade | Year-0 | Year-1 | Year-2 | Year-3 | Year-4 | Year-5 | Year-6 | Year-7 | Year-8 | Year-9 |
|---|---|---|---|---|---|---|---|---|---|---|
| 2000's | 38,380 | 37,836 | 61,737 | 112,734 | 122,086 | |||||
| 2010's | 134,860 | 138,820 | 141,047 | 146,457 | 161,328 | 165,521 | 171,204 | 169,321 | 170,634 | 170,652 |
| 2020's | 153,747 | 167,129 | 168,581 | 168,188 |
| - = No Data Reported; -- = Not Applicable; NA = Not Available; W = Withheld to avoid disclosure of individual company data. |
| Release Date: 6/28/2024 |
| Next Release Date: 8/30/2024 |