|
Download Data (XLS File) |
|
||||||||
|
||||||||
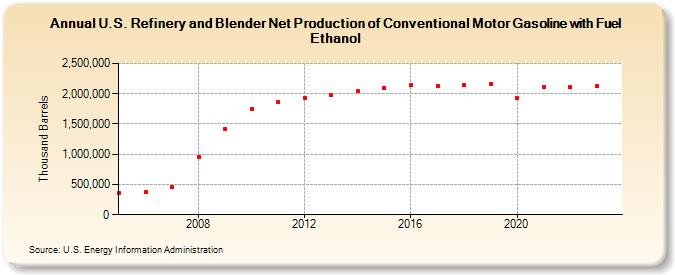
| U.S. Refinery and Blender Net Production of Conventional Motor Gasoline with Fuel Ethanol (Thousand Barrels) | ||||||||
| Decade | Year-0 | Year-1 | Year-2 | Year-3 | Year-4 | Year-5 | Year-6 | Year-7 | Year-8 | Year-9 |
|---|---|---|---|---|---|---|---|---|---|---|
| 2000's | 350,716 | 371,611 | 464,069 | 950,368 | 1,417,783 | |||||
| 2010's | 1,747,270 | 1,860,309 | 1,933,809 | 1,986,615 | 2,038,162 | 2,095,612 | 2,137,052 | 2,135,668 | 2,143,797 | 2,163,416 |
| 2020's | 1,931,924 | 2,104,799 | 2,107,289 | 2,120,397 |
| - = No Data Reported; -- = Not Applicable; NA = Not Available; W = Withheld to avoid disclosure of individual company data. |
| Release Date: 6/28/2024 |
| Next Release Date: 8/30/2024 |