|
Download Data (XLS File) |
|
||||||||
|
||||||||
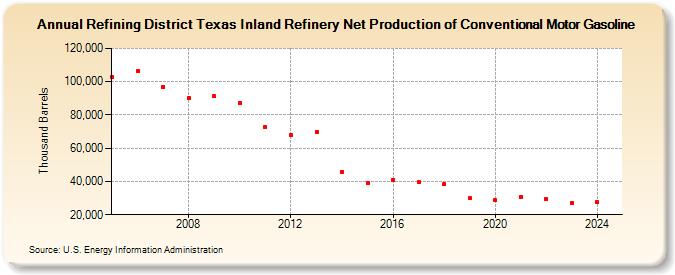
| Refining District Texas Inland Refinery Net Production of Conventional Motor Gasoline (Thousand Barrels) | ||||||||
| Decade | Year-0 | Year-1 | Year-2 | Year-3 | Year-4 | Year-5 | Year-6 | Year-7 | Year-8 | Year-9 |
|---|---|---|---|---|---|---|---|---|---|---|
| 2000's | 102,718 | 106,399 | 97,067 | 90,415 | 91,163 | |||||
| 2010's | 87,062 | 72,653 | 68,198 | 69,900 | 45,830 | 39,127 | 40,933 | 39,443 | 38,238 | 29,752 |
| 2020's | 28,649 | 30,535 | 29,365 | 27,113 |
| - = No Data Reported; -- = Not Applicable; NA = Not Available; W = Withheld to avoid disclosure of individual company data. |
| Release Date: 3/29/2024 |
| Next Release Date: 8/30/2024 |