|
Download Data (XLS File) |
|
||||||||
|
||||||||
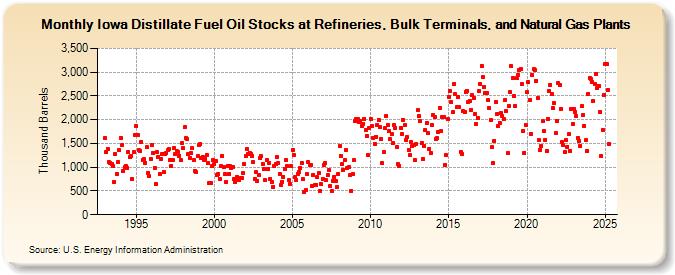
| Iowa Distillate Fuel Oil Stocks at Refineries, Bulk Terminals, and Natural Gas Plants (Thousand Barrels) | ||||||||
| Year | Jan | Feb | Mar | Apr | May | Jun | Jul | Aug | Sep | Oct | Nov | Dec |
|---|---|---|---|---|---|---|---|---|---|---|---|---|
| 1993 | 1,613 | 1,311 | 1,378 | 1,109 | 1,091 | 1,070 | 1,019 | 689 | 1,285 | 861 | 1,105 | 1,355 |
| 1994 | 1,615 | 1,461 | 920 | 994 | 1,026 | 991 | 1,319 | 1,209 | 1,241 | 756 | 1,312 | 1,679 |
| 1995 | 1,872 | 1,682 | 1,358 | 1,350 | 1,531 | 1,154 | 1,166 | 1,094 | 1,417 | 888 | 809 | 1,182 |
| 1996 | 1,467 | 1,306 | 990 | 642 | 1,318 | 1,223 | 857 | 1,170 | 1,287 | 899 | 1,272 | 1,299 |
| 1997 | 1,353 | 1,375 | 1,154 | 1,033 | 1,154 | 1,413 | 1,280 | 1,345 | 1,322 | 1,246 | 1,148 | 1,502 |
| 1998 | 1,399 | 1,838 | 1,609 | 1,588 | 1,273 | 1,199 | 1,295 | 1,396 | 1,142 | 923 | 889 | 1,226 |
| 1999 | 1,460 | 1,487 | 1,202 | 1,222 | 1,154 | 1,173 | 1,257 | 1,095 | 658 | 677 | 1,033 | 1,147 |
| 2000 | 1,069 | 1,136 | 830 | 859 | 762 | 1,021 | 1,238 | 996 | 851 | 694 | 1,030 | 862 |
| 2001 | 1,019 | 983 | 1,003 | 751 | 688 | 790 | 740 | 725 | 773 | 775 | 868 | 1,057 |
| 2002 | 1,237 | 1,378 | 1,286 | 1,304 | 1,288 | 1,237 | 1,108 | 753 | 893 | 717 | 839 | 1,193 |
| 2003 | 1,227 | 1,074 | 963 | 725 | 1,151 | 967 | 1,094 | 752 | 685 | 589 | 1,028 | 1,068 |
| 2004 | 1,211 | 1,095 | 857 | 633 | 696 | 803 | 963 | 1,147 | 1,031 | 723 | 655 | 1,017 |
| 2005 | 1,364 | 1,256 | 804 | 736 | 853 | 908 | 989 | 1,090 | 747 | 471 | 511 | 863 |
| 2006 | 1,109 | 1,052 | 1,042 | 611 | 844 | 618 | 631 | 785 | 872 | 494 | 640 | 753 |
| 2007 | 1,037 | 1,081 | 723 | 834 | 938 | 608 | 502 | 716 | 801 | 705 | 587 | 852 |
| 2008 | 1,439 | 1,244 | 1,065 | 949 | 1,156 | 1,366 | 993 | 996 | 830 | 506 | 859 | 1,147 |
| 2009 | 1,964 | 2,020 | 2,023 | 1,958 | 1,973 | 1,863 | 1,917 | 2,024 | 1,787 | 1,648 | 1,255 | 1,835 |
| 2010 | 2,020 | 1,874 | 1,622 | 1,496 | 1,645 | 1,895 | 1,988 | 1,838 | 1,600 | 1,083 | 1,320 | 1,830 |
| 2011 | 2,080 | 1,888 | 1,761 | 1,586 | 1,708 | 1,519 | 1,888 | 1,830 | 1,434 | 1,067 | 1,031 | 1,833 |
| 2012 | 1,705 | 2,003 | 1,882 | 1,574 | 1,630 | 1,363 | 1,253 | 1,524 | 1,446 | 1,466 | 1,145 | 1,498 |
| 2013 | 2,196 | 2,071 | 1,963 | 1,504 | 1,168 | 1,445 | 1,782 | 1,938 | 1,712 | 1,385 | 1,300 | 1,885 |
| 2014 | 2,094 | 2,060 | 1,596 | 1,605 | 1,731 | 2,248 | 1,756 | 2,050 | 2,053 | 1,042 | 1,253 | 2,012 |
| 2015 | 2,487 | 2,593 | 2,377 | 2,152 | 2,759 | 2,533 | 2,258 | 2,474 | 2,265 | 1,326 | 1,288 | 2,176 |
| 2016 | 2,163 | 2,590 | 2,610 | 2,375 | 2,393 | 2,210 | 2,512 | 2,465 | 2,117 | 1,903 | 2,039 | 2,596 |
| 2017 | 2,751 | 3,138 | 2,889 | 2,693 | 2,568 | 2,567 | 2,407 | 2,236 | 1,984 | 1,415 | 1,086 | 1,560 |
| 2018 | 2,368 | 2,129 | 1,871 | 1,935 | 2,139 | 2,073 | 2,008 | 2,406 | 2,187 | 1,298 | 2,288 | 2,572 |
| 2019 | 3,119 | 2,886 | 2,494 | 2,291 | 2,876 | 2,950 | 3,035 | 3,073 | 2,749 | 1,768 | 1,308 | 1,888 |
| 2020 | 2,576 | 2,786 | 2,406 | 1,703 | 2,949 | 3,058 | 3,042 | 2,820 | 2,454 | 1,562 | 1,367 | 1,444 |
| 2021 | 1,968 | 1,754 | 1,580 | 1,349 | 2,021 | 2,601 | 2,734 | 2,541 | 2,237 | 2,346 | 1,719 | 1,980 |
| 2022 | 2,774 | 2,722 | 2,229 | 1,534 | 1,476 | 1,329 | 1,570 | 1,434 | 1,695 | 1,347 | 2,234 | 1,918 |
| 2023 | 2,222 | 2,167 | 2,069 | 1,616 | 1,543 | 1,456 | 2,279 | 2,100 | 1,873 | 1,563 | 1,340 | 2,547 |
| 2024 | 2,877 | 2,858 | 2,796 | 2,384 | 2,750 | 2,957 | 2,658 | 2,717 | 2,164 | 1,239 | 1,791 | 2,521 |
| 2025 | 3,166 | 3,165 | 2,623 | 1,489 | ||||||||
| - = No Data Reported; -- = Not Applicable; NA = Not Available; W = Withheld to avoid disclosure of individual company data. |
| Release Date: 6/30/2025 |
| Next Release Date: 7/31/2025 |